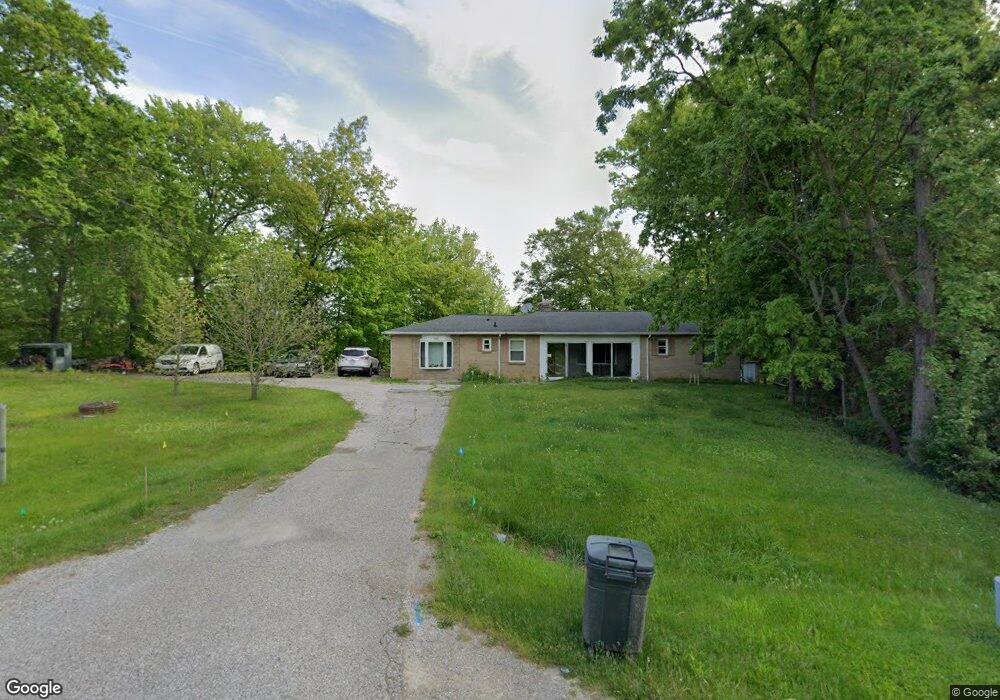
7330 River Rd Flushing, MI 48433
Estimated Value: $182,000 - $223,000
Studio
1
Bath
1,258
Sq Ft
$161/Sq Ft
Est. Value
About This Home
This home is located at 7330 River Rd, Flushing, MI 48433 and is currently estimated at $202,637, approximately $161 per square foot. 7330 River Rd is a home located in Genesee County with nearby schools including Seymour Elementary School, Flushing Middle School, and Flushing High School.
Ownership History
Date
Name
Owned For
Owner Type
Purchase Details
Closed on
Aug 24, 2016
Sold by
Lease Exchange In
Bought by
Currier Glenn C and Lakew Etsegenet L
Current Estimated Value
Home Financials for this Owner
Home Financials are based on the most recent Mortgage that was taken out on this home.
Original Mortgage
$45,764
Interest Rate
3.62%
Mortgage Type
FHA
Purchase Details
Closed on
Dec 19, 2012
Sold by
Currier Glenn C and Lakew Estegenet
Bought by
Land & Lease Exchange Inc
Purchase Details
Closed on
Jul 25, 2012
Sold by
Currier Glenn C and Lakew Estegenet
Bought by
Future Holdings Llc
Home Financials for this Owner
Home Financials are based on the most recent Mortgage that was taken out on this home.
Original Mortgage
$44,845
Interest Rate
11%
Mortgage Type
Purchase Money Mortgage
Purchase Details
Closed on
May 12, 2010
Sold by
Currier Glenn C and Lakew Estegenet
Bought by
Lasalle Bank National Association
Create a Home Valuation Report for This Property
The Home Valuation Report is an in-depth analysis detailing your home's value as well as a comparison with similar homes in the area
Home Values in the Area
Average Home Value in this Area
Purchase History
| Date | Buyer | Sale Price | Title Company |
|---|---|---|---|
| Currier Glenn C | -- | Mason Burgess Title Agency | |
| Land & Lease Exchange Inc | $48,000 | First American Title Ins Co | |
| Future Holdings Llc | $44,845 | None Available | |
| Lasalle Bank National Association | $54,675 | None Available |
Source: Public Records
Mortgage History
| Date | Status | Borrower | Loan Amount |
|---|---|---|---|
| Previous Owner | Currier Glenn C | $45,764 | |
| Previous Owner | Future Holdings Llc | $44,845 |
Source: Public Records
Tax History
| Year | Tax Paid | Tax Assessment Tax Assessment Total Assessment is a certain percentage of the fair market value that is determined by local assessors to be the total taxable value of land and additions on the property. | Land | Improvement |
|---|---|---|---|---|
| 2025 | $1,938 | $70,700 | $0 | $0 |
| 2024 | $1,007 | $67,900 | $0 | $0 |
| 2023 | $961 | $61,700 | $0 | $0 |
| 2022 | $1,736 | $57,200 | $0 | $0 |
| 2021 | $1,702 | $50,100 | $0 | $0 |
| 2020 | $894 | $48,300 | $0 | $0 |
| 2019 | $885 | $45,600 | $0 | $0 |
| 2018 | $1,591 | $44,200 | $0 | $0 |
| 2017 | $783 | $44,200 | $0 | $0 |
| 2016 | $1,460 | $43,200 | $0 | $0 |
| 2015 | $1,319 | $42,800 | $0 | $0 |
| 2014 | $771 | $41,600 | $0 | $0 |
| 2012 | -- | $60,700 | $60,700 | $0 |
Source: Public Records
Map
Nearby Homes
- 7241 Kings Way Unit 88
- 3230 Woodvalley Dr
- 7172 Kings Way Unit 78
- 7160 Kings Way Unit 7476
- 7054 Kings Way
- 7059 Kings Way
- 7042 Kings Way
- 7130 Kings Way
- 7049 Kings Way
- 7053 Kings Way
- 7067 Kings Way
- 7061 Kings Way
- 7058 Kings Way
- 7057 Kings Way
- 7136 Kings Way
- 7134 Kings Way
- 7069 Kings Way
- 7052 Kings Way
- 3149 Stratford Ln
- 1436 E Pierson Rd
- 7306 River Rd
- 7352 River Rd
- 7296 River Rd
- 7359 River Rd
- 7313 River Rd
- 7286 River Rd
- 7303 River Rd
- 3305 Woodvalley Dr
- 7373 River Rd
- 7276 River Rd
- 3320 Woodvalley Dr
- 3297 Woodvalley Dr
- 7388 River Rd
- 7377 River Rd
- 3281 Woodvalley Dr
- 7275 River Rd
- 3306 Woodvalley Dr
- 7385 River Rd
- 7385 River Rd
- 7260 River Rd
Your Personal Tour Guide
Ask me questions while you tour the home.