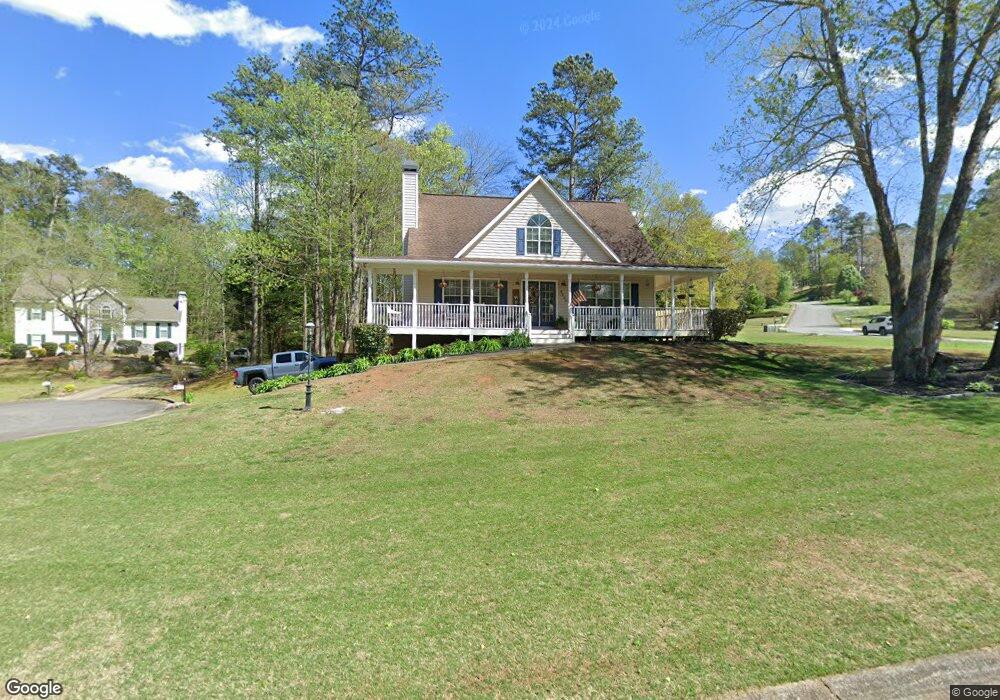
7330 Sleepy Hollow Ct Unit 217 Cumming, GA 30040
Estimated Value: $407,719 - $450,000
3
Beds
3
Baths
1,608
Sq Ft
$270/Sq Ft
Est. Value
About This Home
This home is located at 7330 Sleepy Hollow Ct Unit 217, Cumming, GA 30040 and is currently estimated at $434,680, approximately $270 per square foot. 7330 Sleepy Hollow Ct Unit 217 is a home located in Forsyth County with nearby schools including Coal Mountain Elementary School, North Forsyth Middle School, and North Forsyth High School.
Ownership History
Date
Name
Owned For
Owner Type
Purchase Details
Closed on
Mar 21, 2019
Sold by
Festa Clara
Bought by
Festa Aurelio James Estate and Festa Calra Executor
Current Estimated Value
Home Financials for this Owner
Home Financials are based on the most recent Mortgage that was taken out on this home.
Original Mortgage
$237,500
Outstanding Balance
$208,378
Interest Rate
4.3%
Mortgage Type
New Conventional
Estimated Equity
$226,302
Purchase Details
Closed on
Mar 19, 2019
Sold by
Festa James
Bought by
Festa Aurelio James Estate and Festa Calra Executor
Home Financials for this Owner
Home Financials are based on the most recent Mortgage that was taken out on this home.
Original Mortgage
$237,500
Outstanding Balance
$208,378
Interest Rate
4.3%
Mortgage Type
New Conventional
Estimated Equity
$226,302
Purchase Details
Closed on
Oct 17, 1996
Sold by
Yarbrough Kevin
Bought by
Festa Philomena Aurelio
Create a Home Valuation Report for This Property
The Home Valuation Report is an in-depth analysis detailing your home's value as well as a comparison with similar homes in the area
Home Values in the Area
Average Home Value in this Area
Purchase History
| Date | Buyer | Sale Price | Title Company |
|---|---|---|---|
| Festa Aurelio James Estate | -- | -- | |
| Johnson Chanel Antionette | $250,000 | -- | |
| Festa Aurelio James Estate | -- | -- | |
| Festa Philomena Aurelio | $131,800 | -- |
Source: Public Records
Mortgage History
| Date | Status | Borrower | Loan Amount |
|---|---|---|---|
| Open | Johnson Chanel Antionette | $237,500 | |
| Closed | Festa Aurelio James Estate | $237,500 |
Source: Public Records
Tax History Compared to Growth
Tax History
| Year | Tax Paid | Tax Assessment Tax Assessment Total Assessment is a certain percentage of the fair market value that is determined by local assessors to be the total taxable value of land and additions on the property. | Land | Improvement |
|---|---|---|---|---|
| 2025 | $3,238 | $152,372 | $52,000 | $100,372 |
| 2024 | $3,238 | $155,704 | $48,000 | $107,704 |
| 2023 | $2,712 | $146,388 | $36,000 | $110,388 |
| 2022 | $2,855 | $96,796 | $24,000 | $72,796 |
| 2021 | $2,524 | $96,796 | $24,000 | $72,796 |
| 2020 | $2,459 | $93,652 | $24,000 | $69,652 |
| 2019 | $2,443 | $88,348 | $20,000 | $68,348 |
| 2018 | $2,135 | $77,204 | $18,000 | $59,204 |
| 2017 | $312 | $68,088 | $16,000 | $52,088 |
| 2016 | $312 | $68,088 | $16,000 | $52,088 |
| 2015 | $309 | $66,088 | $14,000 | $52,088 |
| 2014 | $282 | $59,664 | $0 | $0 |
Source: Public Records
Map
Nearby Homes
- 7330 Sleepy Hollow Ct
- 7220 Walnut Mill Landing
- 0 Sleepy Hollow Ct Unit 7482050
- 0 Sleepy Hollow Ct Unit 8529708
- 0 Sleepy Hollow Ct Unit 9007785
- 0 Sleepy Hollow Ct Unit 9026143
- 7340 Sleepy Hollow Ct
- 7315 Sleepy Hollow Ct
- 7210 Walnut Mill Landing
- 7325 Sleepy Hollow Ct
- 7235 Walnut Mill Landing
- 7335 Sleepy Hollow Ct Unit 2
- 7165 Berry Patch Dr
- 7160 Walnut Mill Landing
- 7315 Walnut Mill Landing Unit 2
- 7320 Walnut Mill Landing
- 7175 Berry Patch Dr
- 7220 Hickory Bluff Dr
- 7155 Berry Patch Dr
- 7325 Walnut Mill Landing