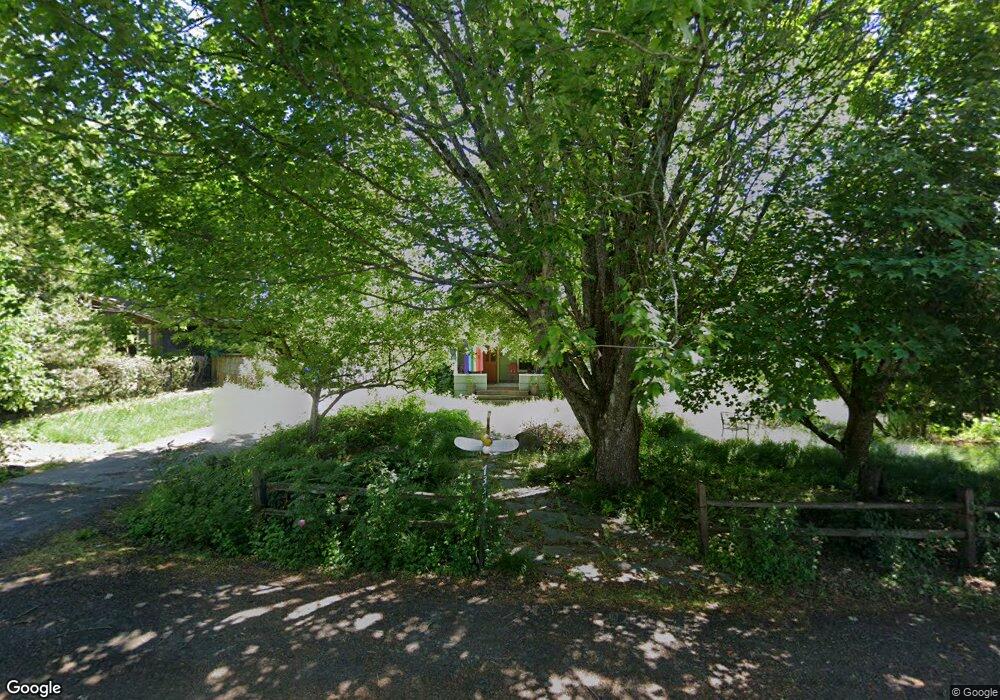
7330 SW 53rd Ave Portland, OR 97219
Maplewood NeighborhoodEstimated Value: $520,000 - $622,654
4
Beds
3
Baths
1,850
Sq Ft
$311/Sq Ft
Est. Value
About This Home
This home is located at 7330 SW 53rd Ave, Portland, OR 97219 and is currently estimated at $575,664, approximately $311 per square foot. 7330 SW 53rd Ave is a home located in Multnomah County with nearby schools including Maplewood Elementary School, Jackson Middle School, and Ida B. Wells-Barnett High School.
Ownership History
Date
Name
Owned For
Owner Type
Purchase Details
Closed on
Jan 19, 2004
Sold by
Rappaport Jesse B
Bought by
Rappaport Jesse B and Spergel Shoshana Z
Current Estimated Value
Home Financials for this Owner
Home Financials are based on the most recent Mortgage that was taken out on this home.
Original Mortgage
$288,000
Outstanding Balance
$139,061
Interest Rate
6.37%
Mortgage Type
Purchase Money Mortgage
Estimated Equity
$436,603
Purchase Details
Closed on
Aug 30, 2001
Sold by
Carlson Robert S
Bought by
Rappaport Jesse B
Home Financials for this Owner
Home Financials are based on the most recent Mortgage that was taken out on this home.
Original Mortgage
$166,700
Interest Rate
9%
Mortgage Type
Purchase Money Mortgage
Purchase Details
Closed on
Jul 15, 1999
Sold by
Tumey Debra Susan
Bought by
Carlson Robert S and Carlson Terri K
Home Financials for this Owner
Home Financials are based on the most recent Mortgage that was taken out on this home.
Original Mortgage
$127,900
Interest Rate
7.51%
Mortgage Type
Purchase Money Mortgage
Create a Home Valuation Report for This Property
The Home Valuation Report is an in-depth analysis detailing your home's value as well as a comparison with similar homes in the area
Home Values in the Area
Average Home Value in this Area
Purchase History
| Date | Buyer | Sale Price | Title Company |
|---|---|---|---|
| Rappaport Jesse B | -- | Pacific Nw Title | |
| Rappaport Jesse B | $175,500 | Ticor Title | |
| Carlson Robert S | $159,900 | Fidelity National Title Co |
Source: Public Records
Mortgage History
| Date | Status | Borrower | Loan Amount |
|---|---|---|---|
| Open | Rappaport Jesse B | $288,000 | |
| Closed | Rappaport Jesse B | $166,700 | |
| Previous Owner | Carlson Robert S | $127,900 |
Source: Public Records
Tax History Compared to Growth
Tax History
| Year | Tax Paid | Tax Assessment Tax Assessment Total Assessment is a certain percentage of the fair market value that is determined by local assessors to be the total taxable value of land and additions on the property. | Land | Improvement |
|---|---|---|---|---|
| 2024 | $7,255 | $271,400 | -- | -- |
| 2023 | $6,976 | $263,500 | $0 | $0 |
| 2022 | $6,825 | $255,830 | $0 | $0 |
| 2021 | $6,709 | $248,380 | $0 | $0 |
| 2020 | $6,155 | $241,150 | $0 | $0 |
| 2019 | $5,928 | $234,135 | $0 | $0 |
| 2018 | $5,128 | $202,600 | $0 | $0 |
| 2017 | $4,915 | $196,700 | $0 | $0 |
| 2016 | $4,498 | $190,980 | $0 | $0 |
| 2015 | $4,380 | $185,420 | $0 | $0 |
| 2014 | $4,314 | $180,020 | $0 | $0 |
Source: Public Records
Map
Nearby Homes
- 7321 SW 52nd Ave
- 7410 SW 54th Ave
- 5049 SW Nevada Ct
- 5033 SW Texas St
- 7491 SW 48th Ave
- 5513 SW Multnomah Blvd
- 5903 SW Miles Ct
- 5503 SW Multnomah Blvd
- 5726 SW Florida St
- 4718 SW Miles Ct
- 5557 SW Multnomah Blvd
- 4598 SW Caldew St
- 5740 SW Vermont St
- 6001 SW Texas Ct
- 5130 SW Multnomah Blvd Unit H
- 5130 SW Multnomah Blvd Unit B
- 5142 SW Multnomah Blvd Unit B
- 5142 SW Multnomah Blvd Unit A
- 6503 SW 46th Place
- 6140 SW Canby St
- 7330 SW 53 Ave
- 7320 SW 53rd Ave
- 7401 SW 52nd Ave
- 7412 SW 53rd Ave
- 7304 SW 53rd Ave
- 7405 SW 52nd Ave
- 7333 SW 53rd Ave
- 7405 SW 53 Ave
- 7254 SW 53rd Ave
- 7315 SW 53rd Ave
- 7405 SW 53rd Ave
- 7313 SW 52nd Ave
- 7301 SW 53 Ave
- 7301 SW 53rd Ave
- 7415 SW 53rd Ave
- 7244 SW 53rd Ave
- 7244 SW 53 Ave
- 7257 SW 53rd Ave
- 7243 SW 52nd Ave
- 7433 SW 53rd Ave