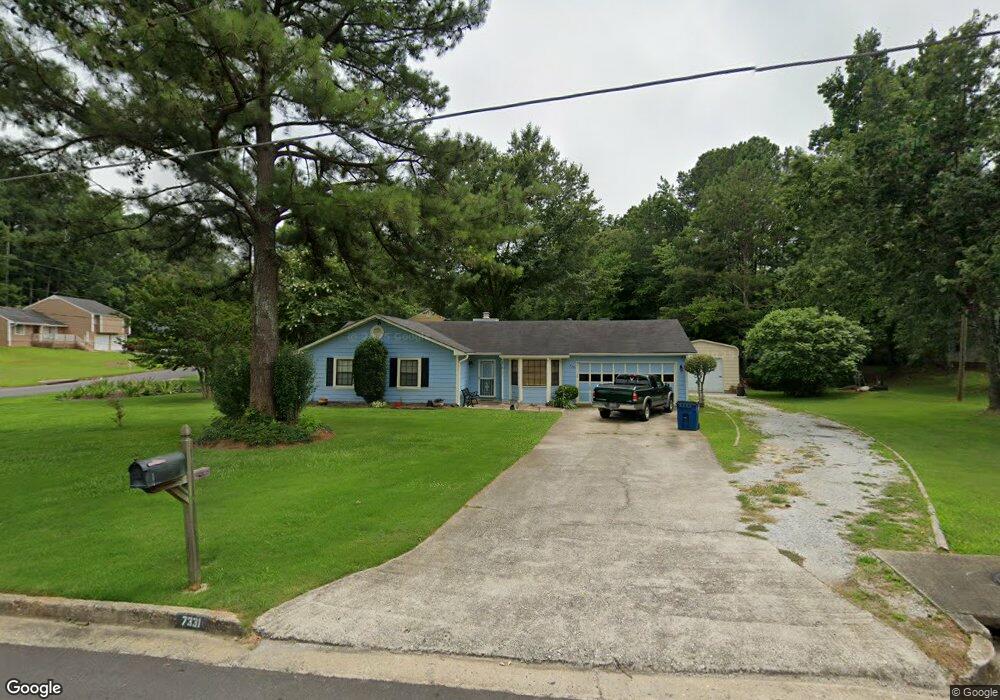
7331 Chilton Ln Unit 4 Riverdale, GA 30296
Estimated Value: $216,000 - $239,000
3
Beds
2
Baths
1,314
Sq Ft
$173/Sq Ft
Est. Value
About This Home
This home is located at 7331 Chilton Ln Unit 4, Riverdale, GA 30296 and is currently estimated at $227,163, approximately $172 per square foot. 7331 Chilton Ln Unit 4 is a home located in Clayton County with nearby schools including Lake Ridge Elementary School, Riverdale Middle School, and Riverdale High School.
Ownership History
Date
Name
Owned For
Owner Type
Purchase Details
Closed on
Nov 27, 2001
Sold by
Smith Rudy B
Bought by
Smith Rudy B and Smith Lori L
Current Estimated Value
Home Financials for this Owner
Home Financials are based on the most recent Mortgage that was taken out on this home.
Original Mortgage
$91,633
Outstanding Balance
$35,886
Interest Rate
6.6%
Mortgage Type
New Conventional
Estimated Equity
$191,277
Purchase Details
Closed on
Jan 5, 2000
Sold by
Smith Rudy B
Bought by
Smith Rudy B and Smith Lori L
Purchase Details
Closed on
Jan 20, 1998
Sold by
Childers Kelly
Bought by
Smith Rudy B
Home Financials for this Owner
Home Financials are based on the most recent Mortgage that was taken out on this home.
Original Mortgage
$86,598
Interest Rate
7.19%
Mortgage Type
VA
Purchase Details
Closed on
Nov 17, 1995
Sold by
Roberts Sterling Brenda W
Bought by
Childers Kelly
Create a Home Valuation Report for This Property
The Home Valuation Report is an in-depth analysis detailing your home's value as well as a comparison with similar homes in the area
Home Values in the Area
Average Home Value in this Area
Purchase History
| Date | Buyer | Sale Price | Title Company |
|---|---|---|---|
| Smith Rudy B | -- | -- | |
| Smith Rudy B | -- | -- | |
| Smith Rudy B | $84,900 | -- | |
| Childers Kelly | $79,900 | -- |
Source: Public Records
Mortgage History
| Date | Status | Borrower | Loan Amount |
|---|---|---|---|
| Open | Smith Rudy B | $91,633 | |
| Previous Owner | Smith Rudy B | $86,598 | |
| Closed | Childers Kelly | $0 |
Source: Public Records
Tax History Compared to Growth
Tax History
| Year | Tax Paid | Tax Assessment Tax Assessment Total Assessment is a certain percentage of the fair market value that is determined by local assessors to be the total taxable value of land and additions on the property. | Land | Improvement |
|---|---|---|---|---|
| 2024 | $2,397 | $70,440 | $7,200 | $63,240 |
| 2023 | $2,649 | $73,360 | $7,200 | $66,160 |
| 2022 | $1,907 | $57,600 | $7,200 | $50,400 |
| 2021 | $1,380 | $43,960 | $7,200 | $36,760 |
| 2020 | $1,138 | $37,483 | $7,200 | $30,283 |
| 2019 | $915 | $31,582 | $4,800 | $26,782 |
| 2018 | $858 | $30,169 | $4,800 | $25,369 |
| 2017 | $516 | $21,721 | $4,800 | $16,921 |
| 2016 | $552 | $22,609 | $4,800 | $17,809 |
| 2015 | $553 | $0 | $0 | $0 |
| 2014 | $521 | $22,106 | $4,800 | $17,306 |
Source: Public Records
Map
Nearby Homes
- 1418 Winchester Trail
- 7396 Petunia Dr
- 7438 Chilton Ln
- 1341 Bethaven Rd
- 7313 Grayson Dr
- 1445 Diplomat Dr
- 7241 Grayson Dr
- 1467 Diplomat Dr
- 1529 Winchester Trail
- 7156 Whitfield Dr
- 0 Creekside Ln Unit 10582617
- 0 Creekside Ln Unit 7631178
- 1464 Riverrock Trail
- 1505 Diplomat Dr
- 7356 Caribou Trail
- 1553 Sultan Ln
- 7694 Creekside Ln
- 1584 Nations Trail
- 7693 Creekside Ln
- 0 Skylane Dr Unit 3187059
- 0 Skylane Dr Unit 7603168
- 0 Skylane Dr Unit 7014909
- 0 Skylane Dr Unit 8883872
- 0 Skylane Dr Unit 8895412
- 0 Skylane Dr
- 7343 Chilton Ln Unit 4
- 7330 Skylane Dr Unit 4
- 7317 Chilton Ln
- 7344 Skylane Dr
- 7355 Chilton Ln
- 7328 Chilton Ln Unit 4
- 7311 Skylane Dr Unit 4
- 7336 Chilton Ln Unit 4
- 7317 Skylane Dr
- 7346 Chilton Ln Unit 4
- 7362 Skylane Dr
- 7313 Chilton Ln
- 7323 Skylane Dr
- 7365 Chilton Ln