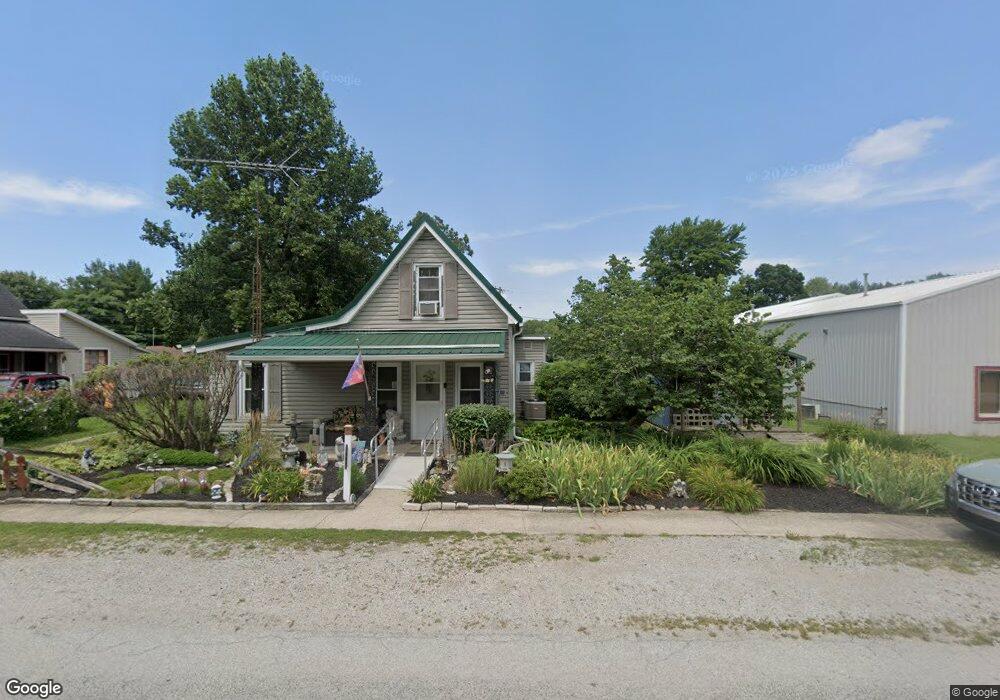
7332 Railroad St Buck Creek, IN 47924
Buck Creek NeighborhoodEstimated Value: $121,554 - $180,000
--
Bed
--
Bath
1,320
Sq Ft
$114/Sq Ft
Est. Value
About This Home
This home is located at 7332 Railroad St, Buck Creek, IN 47924 and is currently estimated at $150,139, approximately $113 per square foot. 7332 Railroad St is a home with nearby schools including Hershey Elementary School, East Tipp Middle School, and William Henry Harrison High School.
Ownership History
Date
Name
Owned For
Owner Type
Purchase Details
Closed on
Dec 22, 2023
Sold by
Tilley Edna A
Bought by
Tilley Robert N and Tilley Tehira L
Current Estimated Value
Purchase Details
Closed on
Jul 27, 2021
Sold by
Tilley Duane R
Bought by
Tilley Edna A
Create a Home Valuation Report for This Property
The Home Valuation Report is an in-depth analysis detailing your home's value as well as a comparison with similar homes in the area
Home Values in the Area
Average Home Value in this Area
Purchase History
| Date | Buyer | Sale Price | Title Company |
|---|---|---|---|
| Tilley Robert N | -- | None Listed On Document | |
| Tilley Edna A | -- | -- |
Source: Public Records
Tax History Compared to Growth
Tax History
| Year | Tax Paid | Tax Assessment Tax Assessment Total Assessment is a certain percentage of the fair market value that is determined by local assessors to be the total taxable value of land and additions on the property. | Land | Improvement |
|---|---|---|---|---|
| 2024 | $1,260 | $84,400 | $9,100 | $75,300 |
| 2023 | $1,280 | $82,100 | $9,100 | $73,000 |
| 2022 | $260 | $73,700 | $9,100 | $64,600 |
| 2021 | $297 | $71,000 | $9,100 | $61,900 |
| 2020 | $282 | $68,200 | $9,100 | $59,100 |
| 2019 | $279 | $68,200 | $9,100 | $59,100 |
| 2018 | $356 | $71,000 | $12,400 | $58,600 |
| 2017 | $314 | $69,800 | $12,400 | $57,400 |
| 2016 | $311 | $68,900 | $12,400 | $56,500 |
| 2014 | $286 | $63,800 | $12,400 | $51,400 |
| 2013 | $298 | $62,900 | $12,400 | $50,500 |
Source: Public Records
Map
Nearby Homes
- 4718 Main St
- 6531 E 450 Rd N
- 2922 Marian Ave
- 6705 Jeffry Ln
- 2326 Stacey Hollow Place
- 5335 Stair Rd
- 6209 Huston Rd
- 5935 Houston Rd
- 7640 N 1000 E
- 7020 Indian Mound Trail
- 7207 E Greenview Dr
- 4038 E 450 N
- 9334 E 200 N
- 2584 N 500 E
- 10030 E 700 N
- 7413 Greenview Dr
- 3816 S Connie Dr
- 4103 Oak Ln
- 2092 Ironbridge Ct
- 1320 Castle Dr