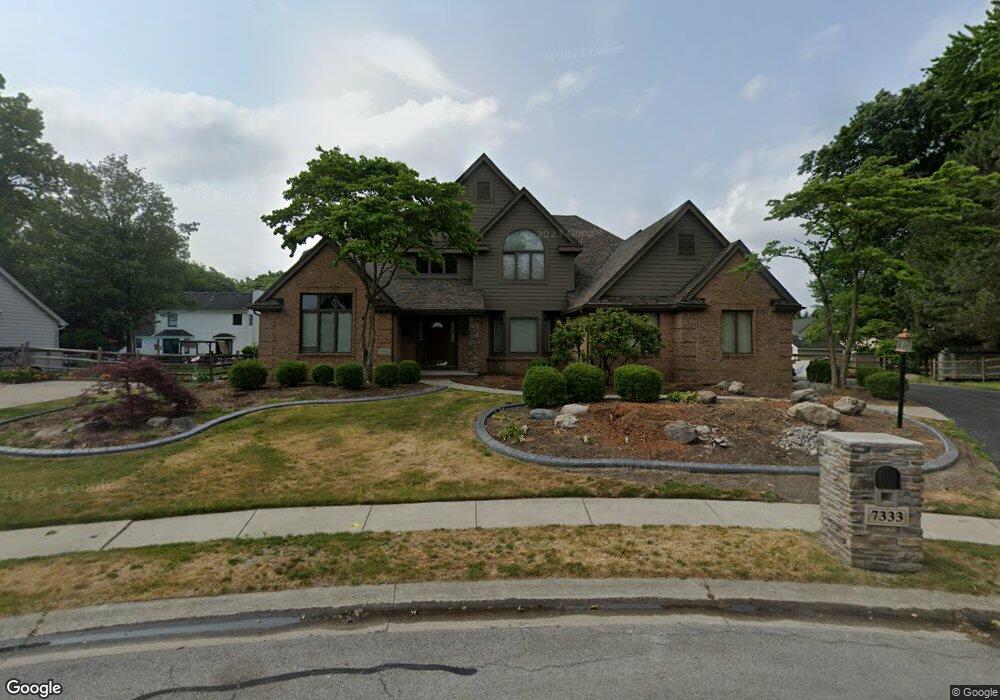
7333 Winsford Ln Sylvania, OH 43560
Estimated Value: $462,319 - $563,000
4
Beds
3
Baths
3,500
Sq Ft
$145/Sq Ft
Est. Value
About This Home
This home is located at 7333 Winsford Ln, Sylvania, OH 43560 and is currently estimated at $507,580, approximately $145 per square foot. 7333 Winsford Ln is a home located in Lucas County with nearby schools including Maplewood Elementary School, Sylvania McCord Junior High School, and Sylvania Northview High School.
Ownership History
Date
Name
Owned For
Owner Type
Purchase Details
Closed on
Jul 27, 2022
Sold by
Day Richard M Trustee Successor Trustee Of The Trust
Bought by
Ibrahim Ramadan
Current Estimated Value
Home Financials for this Owner
Home Financials are based on the most recent Mortgage that was taken out on this home.
Interest Rate
5.54%
Purchase Details
Closed on
Jan 6, 2020
Sold by
Day Kathleen M Trustee
Bought by
Day Richard M Trustee Successor Tru
Home Financials for this Owner
Home Financials are based on the most recent Mortgage that was taken out on this home.
Interest Rate
3.72%
Purchase Details
Closed on
Jul 17, 2010
Sold by
Day Kathleen M and Day Richard M
Bought by
Day Kathleen M and Trust Agreement Of Kathleen M Day
Purchase Details
Closed on
May 24, 2001
Sold by
Day Richard M and Day Kathleen M
Bought by
Day Kathleen M
Create a Home Valuation Report for This Property
The Home Valuation Report is an in-depth analysis detailing your home's value as well as a comparison with similar homes in the area
Home Values in the Area
Average Home Value in this Area
Purchase History
| Date | Buyer | Sale Price | Title Company |
|---|---|---|---|
| Ibrahim Ramadan | $323,100 | -- | |
| Day Richard M Trustee Successor Tru | -- | -- | |
| Day Kathleen M | -- | Attorney | |
| Day Kathleen M | -- | -- |
Source: Public Records
Mortgage History
| Date | Status | Borrower | Loan Amount |
|---|---|---|---|
| Closed | Ibrahim Ramadan | -- | |
| Previous Owner | Ibrahim Ramadan | -- |
Source: Public Records
Tax History Compared to Growth
Tax History
| Year | Tax Paid | Tax Assessment Tax Assessment Total Assessment is a certain percentage of the fair market value that is determined by local assessors to be the total taxable value of land and additions on the property. | Land | Improvement |
|---|---|---|---|---|
| 2024 | $4,224 | $127,540 | $16,485 | $111,055 |
| 2023 | $6,794 | $87,500 | $15,890 | $71,610 |
| 2022 | $9,966 | $132,055 | $15,890 | $116,165 |
| 2021 | $10,206 | $132,055 | $15,890 | $116,165 |
| 2020 | $9,710 | $111,160 | $13,265 | $97,895 |
| 2019 | $9,354 | $111,160 | $13,265 | $97,895 |
| 2018 | $8,755 | $111,160 | $13,265 | $97,895 |
| 2017 | $8,837 | $95,550 | $13,055 | $82,495 |
| 2016 | $8,662 | $273,000 | $37,300 | $235,700 |
| 2015 | $8,171 | $273,000 | $37,300 | $235,700 |
| 2014 | $7,736 | $91,880 | $12,570 | $79,310 |
| 2013 | $7,736 | $91,880 | $12,570 | $79,310 |
Source: Public Records
Map
Nearby Homes
- 4504 Promenade Ln
- 7428 Kings Walk Ln
- 7565 Peachtree Ln
- 9516 Paradise Ln
- 8826 Flint Ct
- 8729 Harlow Ct
- 8816 Harlow Ct
- 8801 Harlow Ct
- 8753 Harlow Ct
- 9017 Driftwood Ct
- 4610 Woodland Ln
- 4731 Weldwood Ln
- 4533 Gettysburg Dr
- 7345 Country Commons Ln
- 4850 Tamworth Rd
- 7413 Sylvania Ave
- 4271 Cranberry Ln
- 7723 Sylvan Oaks Way
- 6922 Gettysburg Dr
- 4814 Sylvan Ct
- 7337 Winsford Ln
- 7336 Country Meadow Ct
- 7328 Country Meadow Ct
- 7344 Country Meadow Ct
- 7320 Country Meadow Ct
- 7315 Winsford Ln
- 7352 Country Meadow Ct
- 7340 Winsford Ln
- 4520 Promenade Ln
- 7326 Winsford Ln
- 4524 Promenade Ln
- 7314 Country Meadow Ct
- 7362 Country Meadow Ct
- 7305 Winsford Ln
- 7331 Country Meadow Ct
- 7339 Country Meadow Ct
- 7347 Country Meadow Ct
- 7323 Country Meadow Ct
- 4524 Country Walk Ln
- 7311 Country Meadow Ct