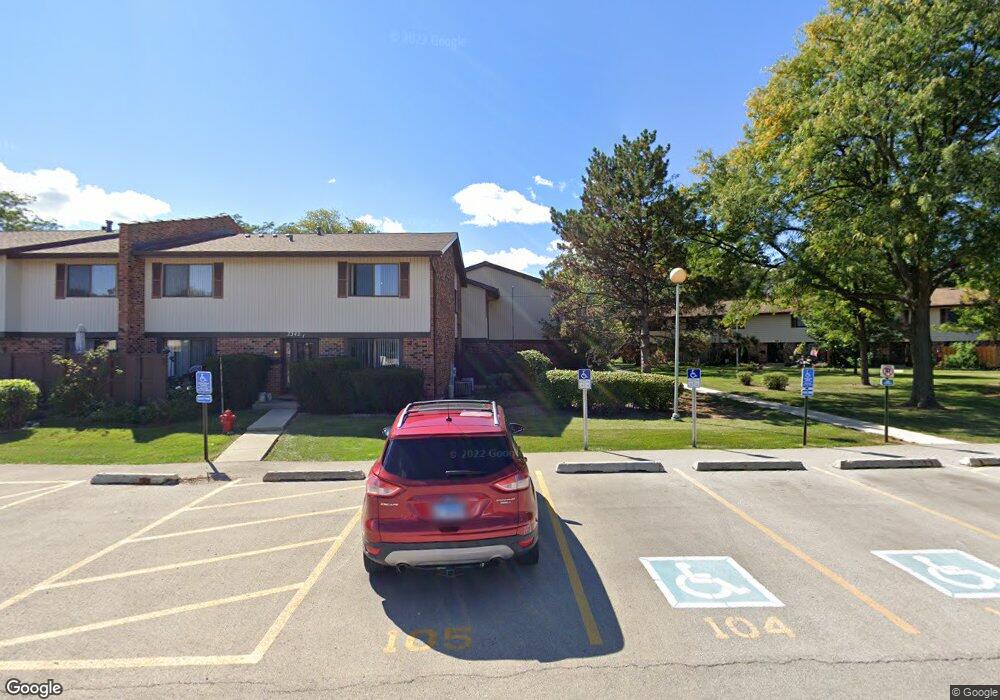
7336 Winthrop Way Unit 197 Downers Grove, IL 60516
South Downers Grove NeighborhoodEstimated Value: $252,000 - $271,000
3
Beds
1
Bath
1,177
Sq Ft
$218/Sq Ft
Est. Value
About This Home
This home is located at 7336 Winthrop Way Unit 197, Downers Grove, IL 60516 and is currently estimated at $256,906, approximately $218 per square foot. 7336 Winthrop Way Unit 197 is a home located in DuPage County with nearby schools including Mark Delay School, Lace Elementary School, and Eisenhower Jr High School.
Ownership History
Date
Name
Owned For
Owner Type
Purchase Details
Closed on
Mar 22, 2010
Sold by
Downers Grove National Bank
Bought by
Bibzak Christopher R
Current Estimated Value
Home Financials for this Owner
Home Financials are based on the most recent Mortgage that was taken out on this home.
Original Mortgage
$103,785
Outstanding Balance
$68,855
Interest Rate
5%
Mortgage Type
FHA
Estimated Equity
$188,051
Purchase Details
Closed on
Nov 24, 2009
Sold by
Tucker Kenneth
Bought by
Downers Grove National Bank
Purchase Details
Closed on
Nov 17, 2006
Sold by
Whisson Jacqueline L
Bought by
Tucker Kenneth
Home Financials for this Owner
Home Financials are based on the most recent Mortgage that was taken out on this home.
Original Mortgage
$79,040
Interest Rate
6.4%
Mortgage Type
Purchase Money Mortgage
Create a Home Valuation Report for This Property
The Home Valuation Report is an in-depth analysis detailing your home's value as well as a comparison with similar homes in the area
Home Values in the Area
Average Home Value in this Area
Purchase History
| Date | Buyer | Sale Price | Title Company |
|---|---|---|---|
| Bibzak Christopher R | $117,000 | Chicago Title Insurance Co | |
| Downers Grove National Bank | -- | Ctic | |
| Tucker Kenneth | $172,000 | First American Title |
Source: Public Records
Mortgage History
| Date | Status | Borrower | Loan Amount |
|---|---|---|---|
| Open | Bibzak Christopher R | $103,785 | |
| Previous Owner | Tucker Kenneth | $79,040 |
Source: Public Records
Tax History Compared to Growth
Tax History
| Year | Tax Paid | Tax Assessment Tax Assessment Total Assessment is a certain percentage of the fair market value that is determined by local assessors to be the total taxable value of land and additions on the property. | Land | Improvement |
|---|---|---|---|---|
| 2024 | $3,649 | $65,355 | $6,744 | $58,611 |
| 2023 | $3,465 | $60,080 | $6,200 | $53,880 |
| 2022 | $3,141 | $53,590 | $5,530 | $48,060 |
| 2021 | $3,050 | $52,980 | $5,470 | $47,510 |
| 2020 | $2,994 | $51,930 | $5,360 | $46,570 |
| 2019 | $2,892 | $49,820 | $5,140 | $44,680 |
| 2018 | $2,533 | $43,510 | $4,490 | $39,020 |
| 2017 | $2,451 | $41,870 | $4,320 | $37,550 |
| 2016 | $2,112 | $36,070 | $8,850 | $27,220 |
| 2015 | $2,064 | $33,940 | $8,330 | $25,610 |
| 2014 | $1,871 | $30,840 | $7,570 | $23,270 |
| 2013 | $2,379 | $38,360 | $9,410 | $28,950 |
Source: Public Records
Map
Nearby Homes
- 7344 Country Creek Way Unit 8
- 7333 Winthrop Way Unit 10
- 7315 Winthrop Way Unit 16
- 7315 Winthrop Way Unit 6
- 7419 Canterbury Place Unit 224
- 521 73rd St Unit 105
- 7353 Blackburn Ave Unit K206
- 7104 Blackburn Ave
- 7517 Main St
- 1145 Crystal Ave
- 7129 Matthias Rd
- 7125 Matthias Rd
- 7104 Kidwell Rd
- 2505 75th St
- 2714 Whitlock Dr
- 512 Redondo Dr Unit 107
- 7920 Woodglen Ln Unit 207
- 7123 Dunham Rd
- 7127 Dunham Rd
- 7625 Dunham Rd
- 7342 Winthrop Way Unit 4
- 7342 Winthrop Way Unit 5
- 7342 Winthrop Way Unit 3
- 7342 Winthrop Way Unit 8
- 7342 Winthrop Way Unit 7
- 7342 Winthrop Way Unit 1911
- 7342 Winthrop Way Unit 1916
- 7342 Winthrop Way Unit 1
- 7342 Winthrop Way Unit 1913
- 7336 Winthrop Way Unit 6
- 7336 Winthrop Way Unit 5
- 7336 Winthrop Way Unit 7
- 7336 Winthrop Way Unit 198
- 7336 Winthrop Way Unit 195
- 7336 Winthrop Way Unit 1
- 7336 Winthrop Way Unit 4
- 7336 Winthrop Way Unit 10
- 7336 Winthrop Way Unit 8
- 7336 Winthrop Way Unit 2
- 7336 Winthrop Way