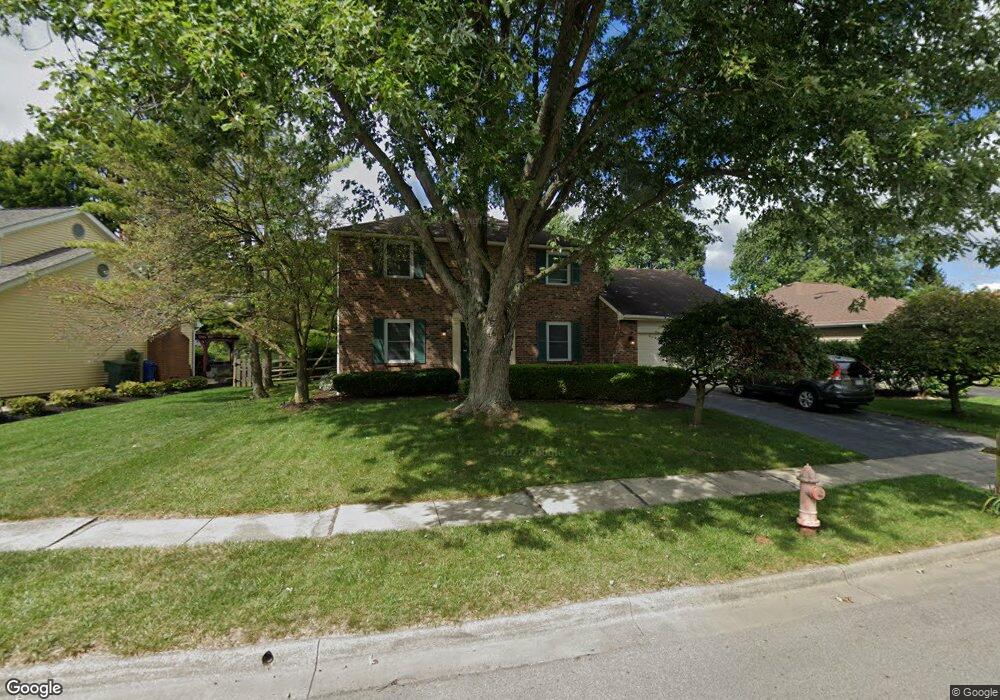
7337 Mapleleaf Blvd Columbus, OH 43235
Brookside Colony NeighborhoodEstimated Value: $385,164 - $473,000
3
Beds
3
Baths
1,790
Sq Ft
$235/Sq Ft
Est. Value
About This Home
This home is located at 7337 Mapleleaf Blvd, Columbus, OH 43235 and is currently estimated at $420,791, approximately $235 per square foot. 7337 Mapleleaf Blvd is a home located in Franklin County with nearby schools including Indian Run Elementary School, Ann Simpson Davis Middle School, and Dublin Scioto High School.
Ownership History
Date
Name
Owned For
Owner Type
Purchase Details
Closed on
Nov 24, 1999
Sold by
Jackson Patrick J and Jackson Shannan S
Bought by
Shaffer Jeffrey B and Shaffer Mary F
Current Estimated Value
Home Financials for this Owner
Home Financials are based on the most recent Mortgage that was taken out on this home.
Original Mortgage
$142,200
Outstanding Balance
$41,886
Interest Rate
7.97%
Estimated Equity
$378,905
Purchase Details
Closed on
Apr 1, 1996
Sold by
Helmick Ronald E
Bought by
Garman Patrick J Jackson and Garman Shanann S
Home Financials for this Owner
Home Financials are based on the most recent Mortgage that was taken out on this home.
Original Mortgage
$102,000
Interest Rate
6.98%
Mortgage Type
Balloon
Purchase Details
Closed on
Jan 5, 1993
Purchase Details
Closed on
Mar 1, 1985
Create a Home Valuation Report for This Property
The Home Valuation Report is an in-depth analysis detailing your home's value as well as a comparison with similar homes in the area
Home Values in the Area
Average Home Value in this Area
Purchase History
| Date | Buyer | Sale Price | Title Company |
|---|---|---|---|
| Shaffer Jeffrey B | $158,000 | Lawyers Title | |
| Garman Patrick J Jackson | $127,500 | -- | |
| -- | $109,000 | -- | |
| -- | $98,000 | -- |
Source: Public Records
Mortgage History
| Date | Status | Borrower | Loan Amount |
|---|---|---|---|
| Open | Shaffer Jeffrey B | $142,200 | |
| Closed | Garman Patrick J Jackson | $102,000 |
Source: Public Records
Tax History
| Year | Tax Paid | Tax Assessment Tax Assessment Total Assessment is a certain percentage of the fair market value that is determined by local assessors to be the total taxable value of land and additions on the property. | Land | Improvement |
|---|---|---|---|---|
| 2025 | $7,703 | $127,370 | $36,720 | $90,650 |
| 2024 | $7,703 | $127,370 | $36,720 | $90,650 |
| 2023 | $7,595 | $127,365 | $36,715 | $90,650 |
| 2022 | $6,877 | $107,170 | $22,540 | $84,630 |
| 2021 | $6,988 | $107,170 | $22,540 | $84,630 |
| 2020 | $6,946 | $107,170 | $22,540 | $84,630 |
| 2019 | $6,419 | $87,680 | $18,800 | $68,880 |
| 2018 | $5,824 | $87,680 | $18,800 | $68,880 |
| 2017 | $5,549 | $87,680 | $18,800 | $68,880 |
| 2016 | $5,171 | $71,860 | $17,190 | $54,670 |
| 2015 | $5,203 | $71,860 | $17,190 | $54,670 |
| 2014 | $5,208 | $71,860 | $17,190 | $54,670 |
| 2013 | $2,644 | $71,855 | $17,185 | $54,670 |
Source: Public Records
Map
Nearby Homes
- 2062 Decker Ct
- 6924 Spruce Pine Dr
- 7155 Asheville Park Dr
- 2487 Timbers Edge Ln Unit 2487
- 2546 Timberside Dr Unit 2546
- 6747 Merwin Rd
- 2001 Sawbury Blvd Unit 2001
- 2026 Sawbury Blvd
- 2024 Sawbury Blvd
- 7641 Old Foxe Ct
- 2279 Fernleaf Ln
- 2469 Sandstrom Dr
- 6789 Meadow Creek Dr Unit 101
- 7370 Coldstream Dr
- 2074 Hard Rd
- 6829 Merwood St
- 7735 Schoolway Ct
- 6637 Merwin Rd
- 6770 Chateau Chase Dr Unit 56770
- 7480 Gardenview Place
- 7345 Mapleleaf Blvd
- 7329 Mapleleaf Blvd
- 7321 Mapleleaf Blvd
- 7353 Mapleleaf Blvd
- 2270 Palmleaf Ct
- 2271 Palmleaf Ct
- 7336 Mapleleaf Blvd
- 7313 Mapleleaf Blvd
- 7328 Mapleleaf Blvd
- 2278 Palmleaf Ct
- 7361 Mapleleaf Blvd
- 7320 Mapleleaf Blvd
- 7344 Mapleleaf Blvd
- 7312 Mapleleaf Blvd
- 2279 Palmleaf Ct
- 2251 Starleaf Ln
- 2236 Sunleaf Ct
- 7358 Mapleleaf Blvd
- 7305 Mapleleaf Blvd
- 7305 Mapleleaf Blvd Unit 1
Your Personal Tour Guide
Ask me questions while you tour the home.