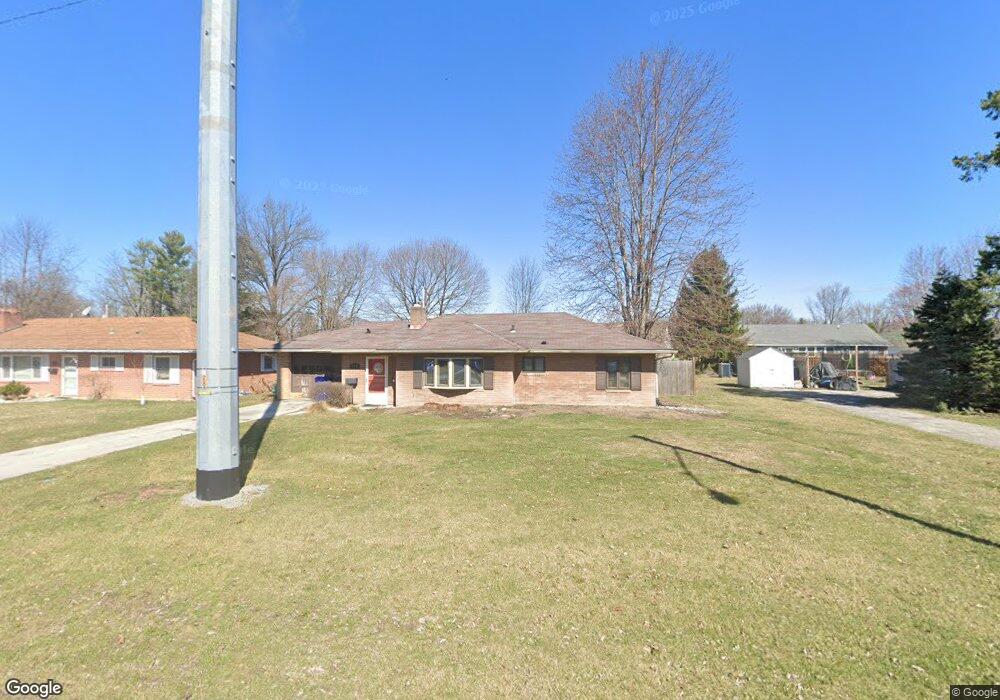
734 5th St Findlay, OH 45840
Estimated Value: $157,000 - $181,000
2
Beds
1
Bath
1,233
Sq Ft
$135/Sq Ft
Est. Value
About This Home
This home is located at 734 5th St, Findlay, OH 45840 and is currently estimated at $166,004, approximately $134 per square foot. 734 5th St is a home located in Hancock County with nearby schools including Whittier Elementary School, Wilson Vance Elementary School, and Donnell Middle School.
Ownership History
Date
Name
Owned For
Owner Type
Purchase Details
Closed on
May 31, 2013
Sold by
Lane John K and Lane Jennifer L
Bought by
Beekman Stefan D
Current Estimated Value
Home Financials for this Owner
Home Financials are based on the most recent Mortgage that was taken out on this home.
Original Mortgage
$85,424
Outstanding Balance
$60,112
Interest Rate
3.25%
Mortgage Type
FHA
Estimated Equity
$105,892
Purchase Details
Closed on
May 3, 2001
Sold by
Layne Michele C
Bought by
Lane John K and Leray Jennifer L
Home Financials for this Owner
Home Financials are based on the most recent Mortgage that was taken out on this home.
Original Mortgage
$84,333
Interest Rate
6.95%
Mortgage Type
FHA
Purchase Details
Closed on
Feb 11, 1987
Bought by
Layne Michele C
Purchase Details
Closed on
Nov 16, 1984
Bought by
Lovell Clarence L
Create a Home Valuation Report for This Property
The Home Valuation Report is an in-depth analysis detailing your home's value as well as a comparison with similar homes in the area
Home Values in the Area
Average Home Value in this Area
Purchase History
| Date | Buyer | Sale Price | Title Company |
|---|---|---|---|
| Beekman Stefan D | $87,000 | Mid American Title Agency I | |
| Lane John K | $85,000 | -- | |
| Layne Michele C | $42,200 | -- | |
| Lovell Clarence L | $42,000 | -- |
Source: Public Records
Mortgage History
| Date | Status | Borrower | Loan Amount |
|---|---|---|---|
| Open | Beekman Stefan D | $85,424 | |
| Previous Owner | Lane John K | $84,333 |
Source: Public Records
Tax History
| Year | Tax Paid | Tax Assessment Tax Assessment Total Assessment is a certain percentage of the fair market value that is determined by local assessors to be the total taxable value of land and additions on the property. | Land | Improvement |
|---|---|---|---|---|
| 2024 | $1,513 | $42,570 | $6,430 | $36,140 |
| 2023 | $1,515 | $42,570 | $6,430 | $36,140 |
| 2022 | $1,510 | $42,570 | $6,430 | $36,140 |
| 2021 | $1,260 | $30,950 | $7,560 | $23,390 |
| 2020 | $1,260 | $30,950 | $7,560 | $23,390 |
| 2019 | $1,235 | $30,950 | $7,560 | $23,390 |
| 2018 | $1,328 | $30,500 | $7,560 | $22,940 |
| 2017 | $663 | $30,500 | $7,560 | $22,940 |
| 2016 | $1,315 | $30,500 | $7,560 | $22,940 |
| 2015 | $1,324 | $30,290 | $7,560 | $22,730 |
| 2014 | $1,325 | $30,290 | $7,560 | $22,730 |
| 2012 | $1,244 | $28,190 | $5,460 | $22,730 |
Source: Public Records
Map
Nearby Homes
- 731 5th St
- 1100 Stall Dr
- 206 Greenlawn Ave
- 1709 Eastview Dr
- 1726 Eastview Dr
- 331 Fairlawn Place
- 123 Glendale Ave
- 315 Fairlawn Place
- 216 1st St
- 0 Blanchard Ave
- 1037 Fishlock Ave
- 829 Maple Ave
- 15591 Canadian Way
- 15586 Canadian Way
- 15615 Canadian Way
- 1304 Douglas Pkwy
- 865 S Main St
- 1200 1st St
- 136 E Hobart Ave
- 209 E Hobart Ave
Your Personal Tour Guide
Ask me questions while you tour the home.