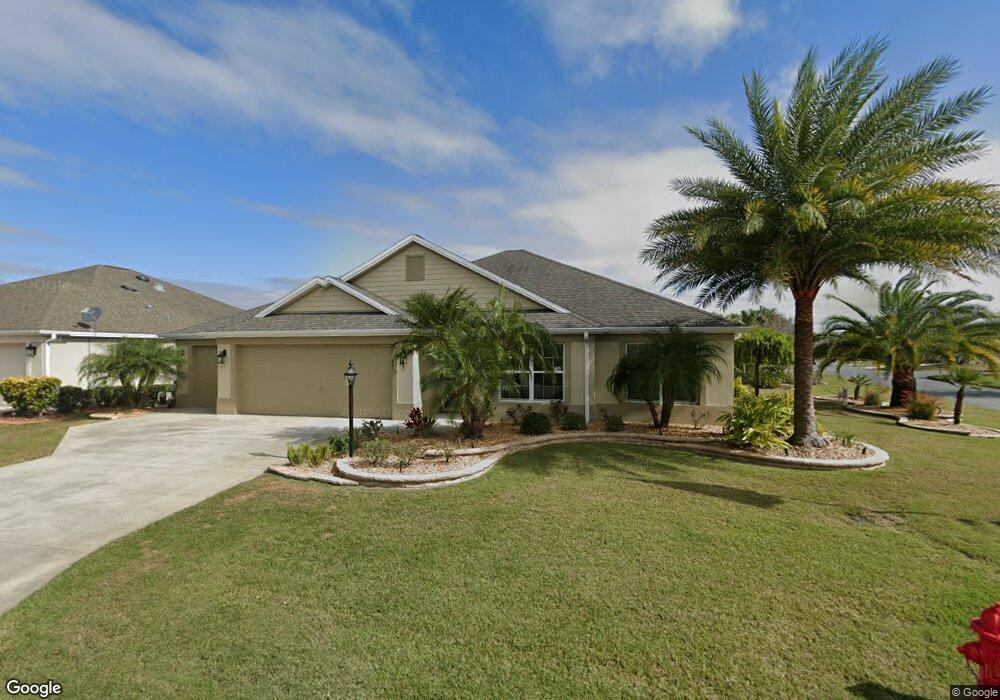
734 Bradford Loop The Villages, FL 32163
Village of Sanibel NeighborhoodEstimated Value: $541,396 - $603,000
--
Bed
--
Bath
2,127
Sq Ft
$267/Sq Ft
Est. Value
About This Home
This home is located at 734 Bradford Loop, The Villages, FL 32163 and is currently estimated at $568,349, approximately $267 per square foot. 734 Bradford Loop is a home with nearby schools including Wildwood Elementary School and Wildwood Middle/High School.
Ownership History
Date
Name
Owned For
Owner Type
Purchase Details
Closed on
Aug 23, 2018
Sold by
Yorton Enterprises Inc
Bought by
Feinberg Thomas W and Feinberg Sandra A
Current Estimated Value
Home Financials for this Owner
Home Financials are based on the most recent Mortgage that was taken out on this home.
Original Mortgage
$190,000
Outstanding Balance
$141,100
Interest Rate
4.5%
Mortgage Type
New Conventional
Estimated Equity
$427,249
Purchase Details
Closed on
Aug 17, 2018
Sold by
Yorton Kristen
Bought by
Yorton Enterprises Inc
Home Financials for this Owner
Home Financials are based on the most recent Mortgage that was taken out on this home.
Original Mortgage
$190,000
Outstanding Balance
$141,100
Interest Rate
4.5%
Mortgage Type
New Conventional
Estimated Equity
$427,249
Purchase Details
Closed on
Feb 19, 2016
Sold by
Yorton Enterprises Inc
Bought by
Yorton Kristen
Purchase Details
Closed on
Mar 29, 2012
Sold by
The Villages Of Lake Sumter Inc
Bought by
Yorton Enterprises Inc
Create a Home Valuation Report for This Property
The Home Valuation Report is an in-depth analysis detailing your home's value as well as a comparison with similar homes in the area
Home Values in the Area
Average Home Value in this Area
Purchase History
| Date | Buyer | Sale Price | Title Company |
|---|---|---|---|
| Feinberg Thomas W | $380,000 | Peninsula Land & Title | |
| Yorton Enterprises Inc | -- | Peninsula Land & Title | |
| Yorton Kristen | $265,300 | Attorney | |
| Yorton Enterprises Inc | $237,995 | Attorney |
Source: Public Records
Mortgage History
| Date | Status | Borrower | Loan Amount |
|---|---|---|---|
| Open | Feinberg Thomas W | $190,000 |
Source: Public Records
Tax History Compared to Growth
Tax History
| Year | Tax Paid | Tax Assessment Tax Assessment Total Assessment is a certain percentage of the fair market value that is determined by local assessors to be the total taxable value of land and additions on the property. | Land | Improvement |
|---|---|---|---|---|
| 2024 | $5,484 | $397,400 | -- | -- |
| 2023 | $5,484 | $385,830 | $0 | $0 |
| 2022 | $5,391 | $374,600 | $0 | $0 |
| 2021 | $5,196 | $320,420 | $41,070 | $279,350 |
| 2020 | $6,475 | $313,240 | $29,460 | $283,780 |
| 2019 | $6,525 | $307,870 | $29,460 | $278,410 |
| 2018 | $5,644 | $263,570 | $29,460 | $234,110 |
| 2017 | $5,774 | $265,410 | $29,460 | $235,950 |
| 2016 | $5,803 | $267,250 | $0 | $0 |
| 2015 | $5,837 | $265,220 | $0 | $0 |
| 2014 | $5,813 | $257,830 | $0 | $0 |
Source: Public Records
Map
Nearby Homes
- 741 Richfield St
- 2725 Halsey Terrace
- 2994 Adrienne Way
- 527 Beville Place
- 669 Pearson St
- 2947 Rain Lily Loop
- 825 Ulelah St
- 2942 Silk Tree Terrace
- 3154 Blythill Ln
- 2739 Midland Terrace
- 3223 Sylewood Ave
- 3203 Islawild Way
- 2530 Saffron Ln
- 506 Deauville Ct
- 2543 Flintshire Ave
- 891 Bartlet Ln
- 2500 Adler Ct
- 3331 Overland Terrace
- 892 Nash Loop
- 2530 Hanlon Terrace
- 730 Bradford Loop
- 668 Bradford Loop
- 674 Bradford Loop
- 678 Bradford Loop
- 726 Bradford Loop
- 735 Bradford Loop
- 742 Bradford Loop
- 739 Bradford Loop
- 731 Bradford Loop
- 660 Bradford Loop
- 682 Bradford Loop
- 722 Bradford Loop
- 727 Bradford Loop
- 743 Bradford Loop
- 746 Bradford Loop
- 671 Alwick Way
- 662 Wellesly Place
- 654 Bradford Loop
- 723 Bradford Loop
- 2971 Braddy Ct