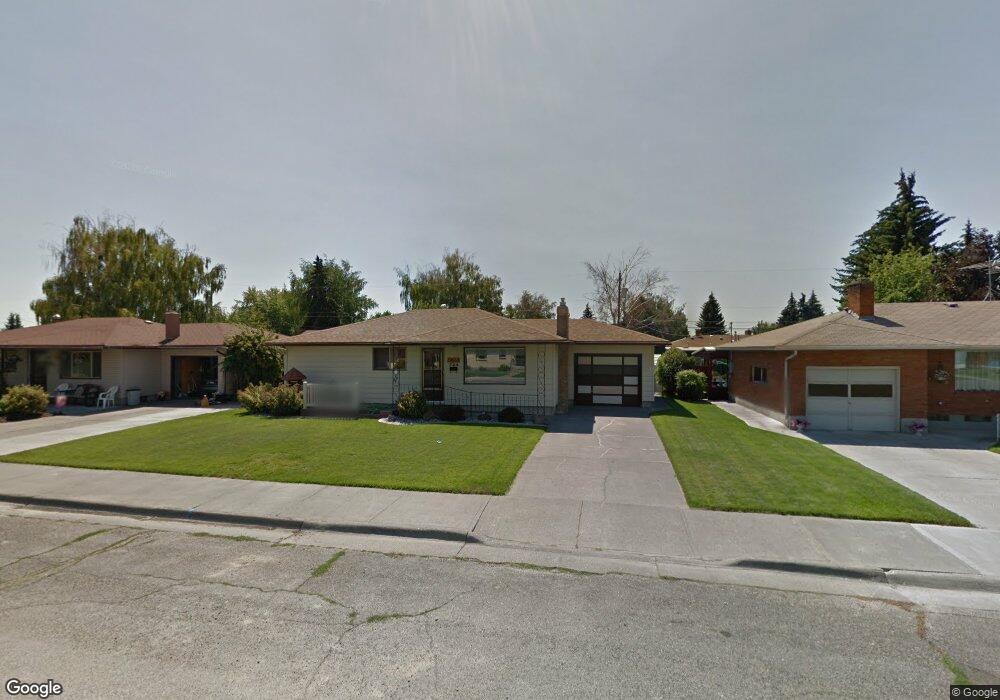
734 E 15th St Idaho Falls, ID 83404
Estimated Value: $292,000 - $313,000
3
Beds
2
Baths
1,746
Sq Ft
$173/Sq Ft
Est. Value
About This Home
This home is located at 734 E 15th St, Idaho Falls, ID 83404 and is currently estimated at $301,577, approximately $172 per square foot. 734 E 15th St is a home located in Bonneville County with nearby schools including Theresa Bunker Elementary School, Taylorview Middle School, and Idaho Falls Senior High School.
Ownership History
Date
Name
Owned For
Owner Type
Purchase Details
Closed on
Mar 26, 2020
Sold by
Fager Roxie and Willard M Fager Family Trust
Bought by
Dipo Nathan Gary and Dipo Amanda Lynn
Current Estimated Value
Home Financials for this Owner
Home Financials are based on the most recent Mortgage that was taken out on this home.
Original Mortgage
$176,543
Outstanding Balance
$155,205
Interest Rate
3.12%
Mortgage Type
FHA
Estimated Equity
$146,372
Create a Home Valuation Report for This Property
The Home Valuation Report is an in-depth analysis detailing your home's value as well as a comparison with similar homes in the area
Home Values in the Area
Average Home Value in this Area
Purchase History
| Date | Buyer | Sale Price | Title Company |
|---|---|---|---|
| Dipo Nathan Gary | -- | Alliance Title & Escrow Corp |
Source: Public Records
Mortgage History
| Date | Status | Borrower | Loan Amount |
|---|---|---|---|
| Open | Dipo Nathan Gary | $176,543 |
Source: Public Records
Tax History Compared to Growth
Tax History
| Year | Tax Paid | Tax Assessment Tax Assessment Total Assessment is a certain percentage of the fair market value that is determined by local assessors to be the total taxable value of land and additions on the property. | Land | Improvement |
|---|---|---|---|---|
| 2025 | $1,193 | $355,840 | $75,735 | $280,105 |
| 2024 | $1,193 | $309,826 | $52,203 | $257,623 |
| 2023 | $1,080 | $256,183 | $52,203 | $203,980 |
| 2022 | $1,367 | $216,147 | $32,927 | $183,220 |
| 2021 | $928 | $154,717 | $32,927 | $121,790 |
| 2019 | $1,070 | $116,097 | $27,427 | $88,670 |
| 2018 | $963 | $117,048 | $24,918 | $92,130 |
| 2017 | $901 | $99,774 | $18,124 | $81,650 |
| 2016 | $866 | $94,054 | $16,504 | $77,550 |
| 2015 | $418 | $86,844 | $16,504 | $70,340 |
| 2014 | $23,859 | $86,844 | $16,504 | $70,340 |
| 2013 | $861 | $92,433 | $16,503 | $75,930 |
Source: Public Records
Map
Nearby Homes