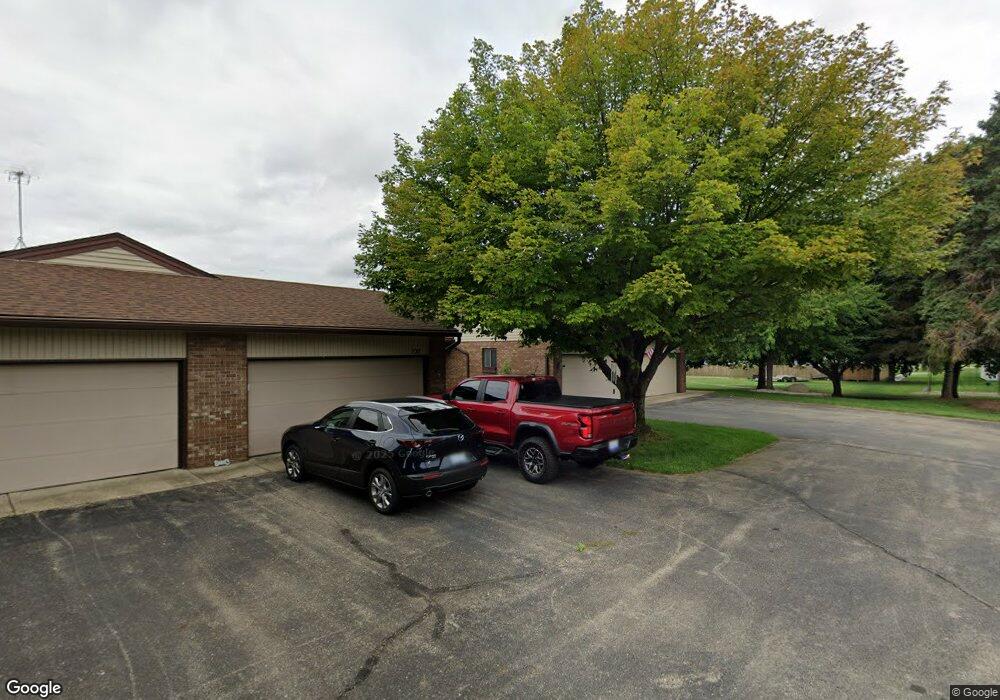
734 Gardenview Dr SW Unit 83 Byron Center, MI 49315
Estimated Value: $270,646 - $296,000
3
Beds
2
Baths
1,000
Sq Ft
$284/Sq Ft
Est. Value
About This Home
This home is located at 734 Gardenview Dr SW Unit 83, Byron Center, MI 49315 and is currently estimated at $283,912, approximately $283 per square foot. 734 Gardenview Dr SW Unit 83 is a home located in Kent County with nearby schools including Marshall Elementary School, Robert L. Nickels Intermediate School, and Byron Center West Middle School.
Ownership History
Date
Name
Owned For
Owner Type
Purchase Details
Closed on
Nov 7, 2024
Sold by
Ussery Carl
Bought by
Ludwig Raymond and Ludwig Margot
Current Estimated Value
Home Financials for this Owner
Home Financials are based on the most recent Mortgage that was taken out on this home.
Original Mortgage
$247,500
Outstanding Balance
$245,018
Interest Rate
6.08%
Mortgage Type
New Conventional
Estimated Equity
$38,894
Purchase Details
Closed on
Jul 31, 2020
Sold by
Wustman Velma R
Bought by
Ussey Carl
Home Financials for this Owner
Home Financials are based on the most recent Mortgage that was taken out on this home.
Original Mortgage
$209,900
Interest Rate
2.9%
Mortgage Type
VA
Purchase Details
Closed on
Feb 6, 2013
Sold by
Wustman Julius D and Wustman Velma R
Bought by
Wustman Julius D and Wustman Velma R
Create a Home Valuation Report for This Property
The Home Valuation Report is an in-depth analysis detailing your home's value as well as a comparison with similar homes in the area
Home Values in the Area
Average Home Value in this Area
Purchase History
| Date | Buyer | Sale Price | Title Company |
|---|---|---|---|
| Ludwig Raymond | $275,000 | Ata National Title | |
| Ludwig Raymond | $275,000 | Ata National Title | |
| Ussey Carl | $209,900 | Ata National Title Group Llc | |
| Wustman Julius D | -- | None Available |
Source: Public Records
Mortgage History
| Date | Status | Borrower | Loan Amount |
|---|---|---|---|
| Open | Ludwig Raymond | $247,500 | |
| Closed | Ludwig Raymond | $247,500 | |
| Previous Owner | Ussey Carl | $209,900 |
Source: Public Records
Tax History Compared to Growth
Tax History
| Year | Tax Paid | Tax Assessment Tax Assessment Total Assessment is a certain percentage of the fair market value that is determined by local assessors to be the total taxable value of land and additions on the property. | Land | Improvement |
|---|---|---|---|---|
| 2025 | -- | $122,600 | $0 | $0 |
| 2024 | -- | $115,300 | $0 | $0 |
| 2023 | $1,859 | $0 | $0 | $0 |
| 2022 | $3,718 | $0 | $0 | $0 |
| 2021 | $1,859 | $86,800 | $0 | $0 |
| 2020 | $1,133 | $82,100 | $0 | $0 |
| 2019 | $1,607 | $76,800 | $0 | $0 |
| 2018 | $1,574 | $69,300 | $5,500 | $63,800 |
| 2017 | $1,531 | $60,200 | $0 | $0 |
| 2016 | $1,476 | $56,000 | $0 | $0 |
| 2015 | $1,450 | $56,000 | $0 | $0 |
| 2013 | -- | $47,300 | $0 | $0 |
Source: Public Records
Map
Nearby Homes
- 825 Amber Ridge Dr SW
- 907 Amber View Dr SW
- 1058 Amberwood West Dr SW
- 924 Amberwood West Dr SW
- 1010 Bellview Meadow Dr SW Unit 68
- 1012 Bellview Meadow Dr SW
- 7150 Friar Way Ave SW
- 6696 Highmeadow Dr SW
- 176 Tewksbury Dr SW
- 1220 Kingman Ct SW
- 1209 Madera Ct
- 6540 Kingtree Dr SW
- 1211 Madera Ct
- 1213 Madera Ct
- 1215 Madera Ct
- 6787 Sunfield Dr SW
- 1223 Madera Ct
- 1171 Runway Place SW
- 6745 Buchanan Ave SW
- 7356 Cactus Cove SW
- 734 Gardenview Dr SW
- 734 Gardenview Dr SW Unit 83
- 732 Gardenview Dr SW
- 732 Gardenview Dr SW
- 730 Gardenview Dr SW
- 728 Gardenview Dr SW
- 728 Gardenview Dr SW Unit 86
- 726 Gardenview Dr SW
- 724 Gardenview Dr SW
- 698 Gardenview Dr SW Unit 89
- 698 Gardenview Dr SW Unit 89
- 7027 Gardenview Ct SW
- 7027 Gardenview Ct SW
- 7029 Gardenview Ct SW Unit 14
- 7031 Gardenview Ct SW
- 696 Gardenview Dr SW Unit 90
- 696 Gardenview Dr SW
- 7033 Gardenview Ct SW
- 7033 Gardenview Ct SW Unit 16
- 7028 Gardenview Ct SW