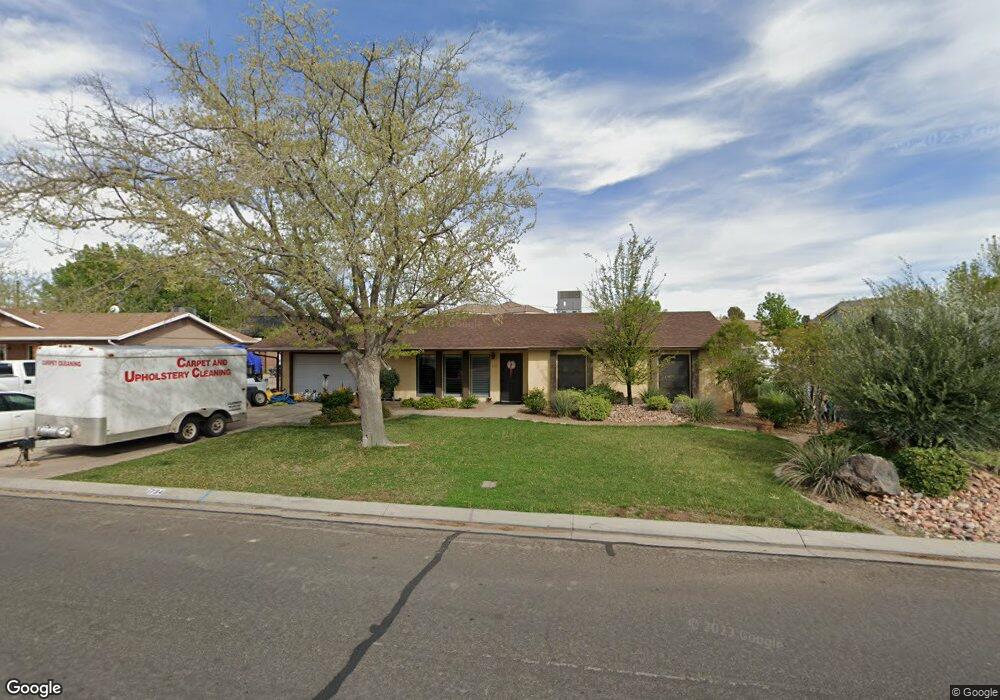
734 Lava Flow Dr Santa Clara, UT 84765
Estimated Value: $451,446 - $529,000
3
Beds
2
Baths
1,388
Sq Ft
$353/Sq Ft
Est. Value
About This Home
This home is located at 734 Lava Flow Dr, Santa Clara, UT 84765 and is currently estimated at $490,223, approximately $353 per square foot. 734 Lava Flow Dr is a home located in Washington County with nearby schools including Arrowhead School, Snow Canyon Middle School, and Lava Ridge Intermediate School.
Ownership History
Date
Name
Owned For
Owner Type
Purchase Details
Closed on
Mar 21, 2018
Sold by
Hales Joan B and The Robert And Joan Hales Fami
Bought by
Hales Joan B and Hales Mark B
Current Estimated Value
Home Financials for this Owner
Home Financials are based on the most recent Mortgage that was taken out on this home.
Original Mortgage
$100,000
Interest Rate
4.38%
Mortgage Type
Purchase Money Mortgage
Purchase Details
Closed on
Mar 20, 2018
Sold by
Hales Joan B and Hales Mark B
Bought by
Lindsey Mary Ann and The Lindsey Family Trust
Home Financials for this Owner
Home Financials are based on the most recent Mortgage that was taken out on this home.
Original Mortgage
$100,000
Interest Rate
4.38%
Mortgage Type
Purchase Money Mortgage
Purchase Details
Closed on
Jun 16, 2014
Sold by
Hales Robert L and Hales Joan B
Bought by
Compas Jeffrey C and Compas Jennifer
Purchase Details
Closed on
Dec 1, 2005
Sold by
Hales Mark B and Hales Robert L
Bought by
Hales Robert L and Hales Joan B
Create a Home Valuation Report for This Property
The Home Valuation Report is an in-depth analysis detailing your home's value as well as a comparison with similar homes in the area
Home Values in the Area
Average Home Value in this Area
Purchase History
| Date | Buyer | Sale Price | Title Company |
|---|---|---|---|
| Hales Joan B | -- | None Available | |
| Lindsey Mary Ann | -- | None Available | |
| Compas Jeffrey C | -- | None Available | |
| Hales Robert L | -- | None Available |
Source: Public Records
Mortgage History
| Date | Status | Borrower | Loan Amount |
|---|---|---|---|
| Previous Owner | Lindsey Mary Ann | $100,000 |
Source: Public Records
Tax History Compared to Growth
Tax History
| Year | Tax Paid | Tax Assessment Tax Assessment Total Assessment is a certain percentage of the fair market value that is determined by local assessors to be the total taxable value of land and additions on the property. | Land | Improvement |
|---|---|---|---|---|
| 2025 | $1,432 | $210,430 | $90,750 | $119,680 |
| 2023 | $1,465 | $214,555 | $88,000 | $126,555 |
| 2022 | $1,482 | $203,940 | $71,500 | $132,440 |
| 2021 | $1,254 | $256,600 | $65,000 | $191,600 |
| 2020 | $1,140 | $219,800 | $65,000 | $154,800 |
| 2019 | $1,128 | $212,300 | $65,000 | $147,300 |
| 2018 | $1,825 | $172,000 | $0 | $0 |
| 2017 | $1,706 | $160,800 | $0 | $0 |
| 2016 | $1,742 | $151,900 | $0 | $0 |
| 2015 | $1,785 | $149,300 | $0 | $0 |
| 2014 | $1,589 | $134,200 | $0 | $0 |
Source: Public Records
Map
Nearby Homes
- 0 Claude Dr
- 865 Lava Flow Dr
- 340 Le Grande Cir
- 875 Country Ln
- 2394 W Chardonnay
- 765 Country Place Ct
- 1594 W Sunset Blvd Unit 3
- 2447 Arrowhead Trail
- 2393 W Zinfandel Dr
- 870 Lugano Ln
- 874 Lugano Ln
- 363 Lost Creek Dr W
- 2166 W 1010 N Unit 42
- 565 N Moonglow Place
- 1040 N 2000 W
- 1259 N 2190 W
- 271 N Country Ln Unit 60
- 271 N Country Ln Unit B14
- 2186 W 1270 N
- 1950 W 470 St N
- 748 Lava Flow Dr
- 718 Lava Flow Dr
- 787 Swiss Haven Cir
- 766 Lava Flow Dr
- 790 Swiss Haven Cir
- 2514 Concord Ave
- 727 Lava Flow Dr
- 2498 Concord Ave
- 2299 Meadow View Cir
- 733 Lava Flow Dr
- 2522 Concord Ave
- 768 Lava Flow Dr
- 785 Swiss Haven Cir
- 2474 Concord Ave
- 797 Swiss Haven Cir
- 2301 Meadow View Cir
- 717 Lava Flow Dr
- 794 Lava Flow Dr
- 705 Lava Flow Dr
- 793 Lava Flow Dr