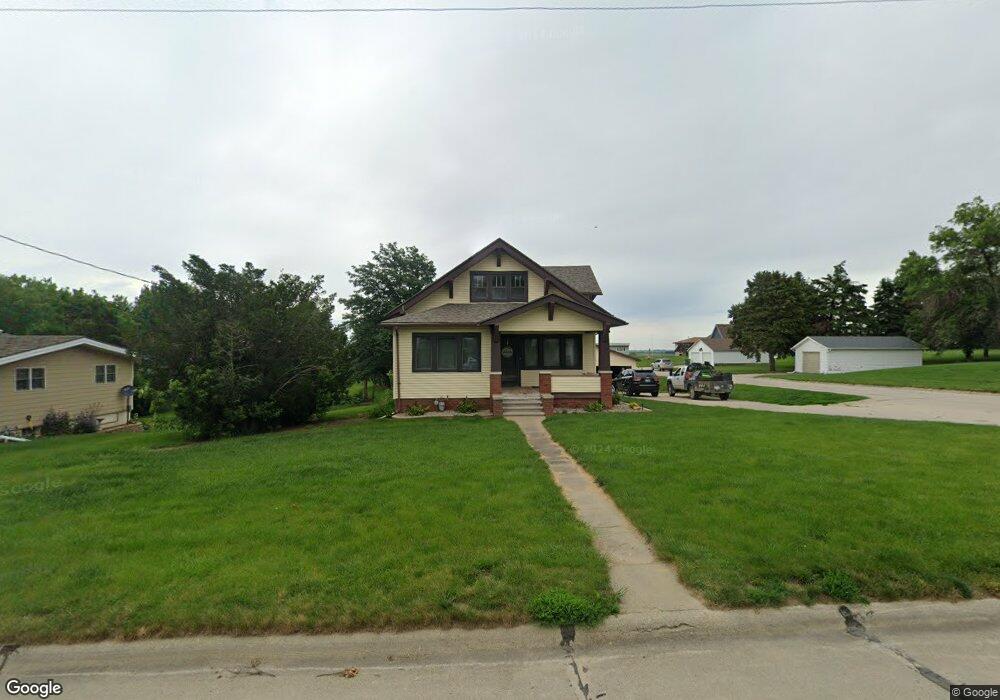
734 Main St Bancroft, NE 68004
Estimated Value: $126,000 - $200,000
Studio
2
Baths
2,215
Sq Ft
$76/Sq Ft
Est. Value
About This Home
This home is located at 734 Main St, Bancroft, NE 68004 and is currently estimated at $167,483, approximately $75 per square foot. 734 Main St is a home located in Cuming County with nearby schools including Bancroft-Rosalie Elementary School.
Ownership History
Date
Name
Owned For
Owner Type
Purchase Details
Closed on
Nov 13, 2020
Sold by
Soll Delmer and Soll Laurie
Bought by
Tietz Teresa A
Current Estimated Value
Home Financials for this Owner
Home Financials are based on the most recent Mortgage that was taken out on this home.
Original Mortgage
$72,000
Outstanding Balance
$64,582
Interest Rate
3.5%
Mortgage Type
New Conventional
Estimated Equity
$102,901
Purchase Details
Closed on
Jan 13, 2015
Sold by
Lund Barry C
Bought by
Lund Betty L
Create a Home Valuation Report for This Property
The Home Valuation Report is an in-depth analysis detailing your home's value as well as a comparison with similar homes in the area
Purchase History
| Date | Buyer | Sale Price | Title Company |
|---|---|---|---|
| Tietz Teresa A | $90,000 | None Available | |
| Lund Betty L | -- | None Available |
Source: Public Records
Mortgage History
| Date | Status | Borrower | Loan Amount |
|---|---|---|---|
| Open | Tietz Teresa A | $72,000 |
Source: Public Records
Tax History
| Year | Tax Paid | Tax Assessment Tax Assessment Total Assessment is a certain percentage of the fair market value that is determined by local assessors to be the total taxable value of land and additions on the property. | Land | Improvement |
|---|---|---|---|---|
| 2025 | $1,656 | $175,945 | $12,405 | $163,540 |
| 2024 | $1,656 | $163,840 | $12,405 | $151,435 |
| 2023 | $1,434 | $110,310 | $11,030 | $99,280 |
| 2022 | $1,482 | $103,995 | $9,650 | $94,345 |
| 2021 | $1,658 | $116,310 | $4,135 | $112,175 |
| 2020 | $1,698 | $116,310 | $4,135 | $112,175 |
| 2019 | $1,658 | $113,980 | $4,135 | $109,845 |
| 2018 | $1,371 | $95,025 | $4,135 | $90,890 |
| 2017 | $1,306 | $95,025 | $4,135 | $90,890 |
| 2016 | $1,257 | $95,025 | $4,135 | $90,890 |
| 2015 | $1,245 | $95,025 | $4,135 | $90,890 |
| 2014 | $1,477 | $75,245 | $4,135 | $71,110 |
| 2013 | $1,477 | $75,245 | $4,135 | $71,110 |
Source: Public Records
Map
Nearby Homes
- 209 E Grove St
- 103 Washington St
- 2615 P Ave
- Lot 94 Blue Sage
- 330 Pearl St
- 440 State St
- 325 Crystal St
- 204 2nd St
- 305 Carnes Ave
- 1107 Whitney St
- 1111 Whitney St
- 203 S Little St
- Road 14 Road W Rd
- 1225 Co Road 1
- Lyons Unit NE 68038
- 1245 M Ave
- 820 N Oakland Ave
- 521 N Logan Ave
- 515 N Thomas Ave
- 328 N Oakland Ave
Your Personal Tour Guide
Ask me questions while you tour the home.