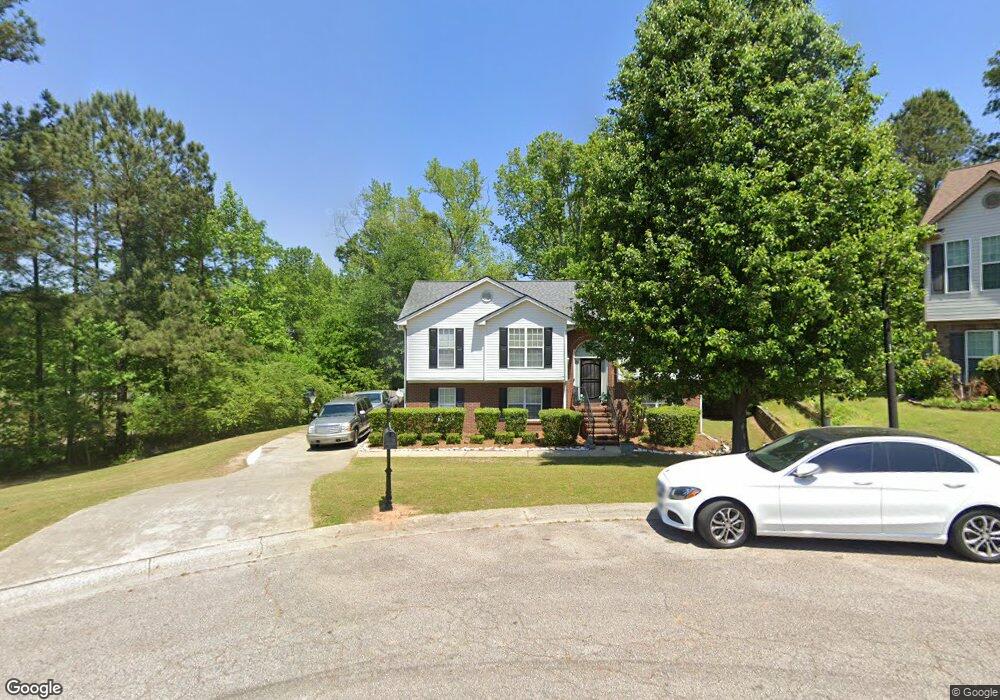
734 Mallard Dr Unit 1 Winder, GA 30680
Estimated Value: $361,027 - $383,000
5
Beds
3
Baths
2,017
Sq Ft
$183/Sq Ft
Est. Value
About This Home
This home is located at 734 Mallard Dr Unit 1, Winder, GA 30680 and is currently estimated at $369,007, approximately $182 per square foot. 734 Mallard Dr Unit 1 is a home located in Barrow County with nearby schools including County Line Elementary School, Russell Middle School, and Winder-Barrow High School.
Ownership History
Date
Name
Owned For
Owner Type
Purchase Details
Closed on
Aug 16, 2007
Sold by
Hall David L
Bought by
Mcfarlane Fabian C and Mcfarlane Jennifer
Current Estimated Value
Home Financials for this Owner
Home Financials are based on the most recent Mortgage that was taken out on this home.
Original Mortgage
$156,275
Outstanding Balance
$98,895
Interest Rate
6.65%
Mortgage Type
New Conventional
Estimated Equity
$270,112
Purchase Details
Closed on
Dec 31, 2004
Sold by
Wells Fargo Bk
Bought by
Hall David L
Purchase Details
Closed on
Sep 7, 2004
Sold by
Tatham Chadwick B
Bought by
Wells Fargo Bk
Purchase Details
Closed on
Sep 10, 2001
Sold by
Star Home Builders
Bought by
Tatham Chadwick B
Home Financials for this Owner
Home Financials are based on the most recent Mortgage that was taken out on this home.
Original Mortgage
$104,900
Interest Rate
6.6%
Mortgage Type
New Conventional
Create a Home Valuation Report for This Property
The Home Valuation Report is an in-depth analysis detailing your home's value as well as a comparison with similar homes in the area
Home Values in the Area
Average Home Value in this Area
Purchase History
| Date | Buyer | Sale Price | Title Company |
|---|---|---|---|
| Mcfarlane Fabian C | $164,500 | -- | |
| Hall David L | $131,000 | -- | |
| Wells Fargo Bk | $121,600 | -- | |
| Tatham Chadwick B | $139,900 | -- |
Source: Public Records
Mortgage History
| Date | Status | Borrower | Loan Amount |
|---|---|---|---|
| Open | Mcfarlane Fabian C | $156,275 | |
| Previous Owner | Tatham Chadwick B | $104,900 |
Source: Public Records
Tax History Compared to Growth
Tax History
| Year | Tax Paid | Tax Assessment Tax Assessment Total Assessment is a certain percentage of the fair market value that is determined by local assessors to be the total taxable value of land and additions on the property. | Land | Improvement |
|---|---|---|---|---|
| 2024 | $3,174 | $115,579 | $28,000 | $87,579 |
| 2023 | $2,689 | $115,579 | $28,000 | $87,579 |
| 2022 | $2,448 | $74,638 | $16,400 | $58,238 |
| 2021 | $2,531 | $74,638 | $16,400 | $58,238 |
| 2020 | $2,294 | $69,818 | $16,400 | $53,418 |
| 2019 | $2,325 | $69,818 | $16,400 | $53,418 |
| 2018 | $2,117 | $63,798 | $15,200 | $48,598 |
| 2017 | $1,631 | $54,680 | $15,200 | $39,480 |
| 2016 | $1,654 | $53,153 | $15,200 | $37,953 |
| 2015 | $1,656 | $53,153 | $15,200 | $37,953 |
| 2014 | $1,371 | $45,240 | $6,860 | $38,380 |
| 2013 | -- | $42,823 | $6,860 | $35,963 |
Source: Public Records
Map
Nearby Homes
- 469 Plantation Dr
- 707 Overlook Dr Unit 1
- 381 W Candler St
- 553 Drake Cir
- 672 Meadowbrook Dr
- 401 N 5th Ave
- The Cary A Plan at Lake Shore
- The Marion A Plan at Lake Shore
- 642 Teal Dr
- 94 Garrison Dr
- 121 Ashwood Dr
- 418 Jasmine Dr
- 501 Valleyview Dr
- 254 Cedar Wood Trace
- 249 Cedar Wood Trace
- 254 Partridge Trail
- 733 Mallard Dr
- 732 Mallard Dr Unit 24
- 732 Mallard Dr
- 731 Mallard Dr
- 730 Mallard Dr Unit 1
- 729 Mallard Dr
- 728 Mallard Dr
- 727 Mallard Dr Unit 1
- 726 Mallard Dr
- 725 Mallard Dr
- 764 City Pond Rd
- 724 Mallard Dr Unit 1
- 708 High Point Dr
- 723 Mallard Dr Unit 24
- 723 Mallard Dr
- 772 City Pond Rd Unit 11,12,13,14
- 772 City Pond Rd
- 722 Mallard Dr Unit I
- 721 Mallard Dr
- 721 Mallard Dr Unit 1