Estimated Value: $236,000 - $266,000
3
Beds
2
Baths
1,372
Sq Ft
$181/Sq Ft
Est. Value
About This Home
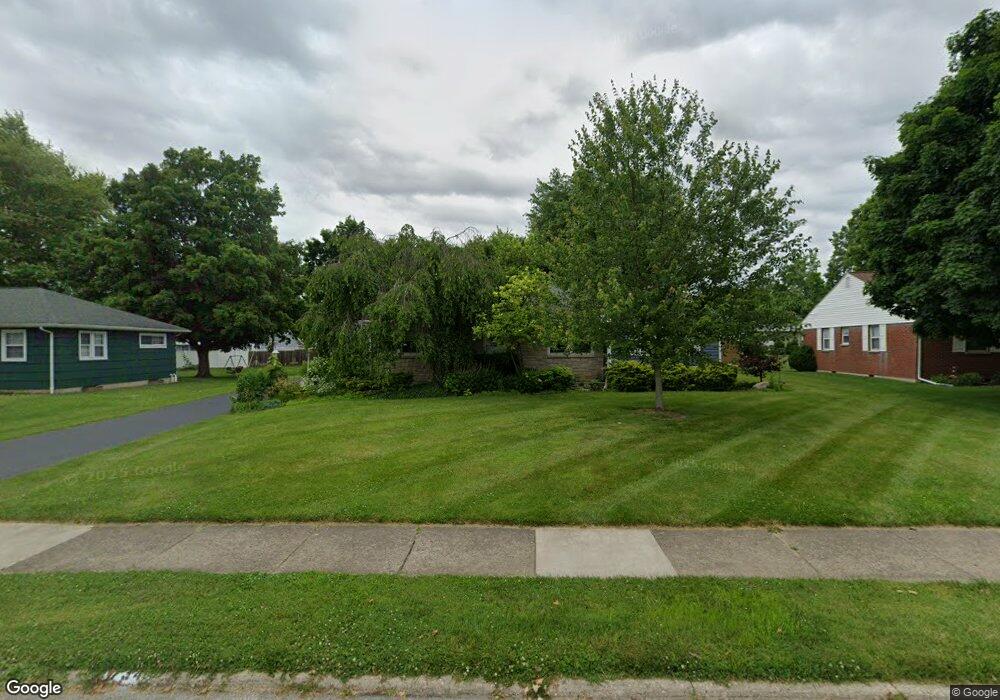
This home is located at 734 N Monroe Dr, Xenia, OH 45385 and is currently estimated at $248,764, approximately $181 per square foot. 734 N Monroe Dr is a home located in Greene County with nearby schools including Xenia High School, Summit Academy Community School for Alternative Learners - Xenia, and Legacy Christian Academy.
Ownership History
Date
Name
Owned For
Owner Type
Purchase Details
Closed on
Apr 15, 2020
Sold by
Gordon Joyce E and Judd Joyce E
Bought by
Hoyer John E and Hoyer Jerry A
Current Estimated Value
Home Financials for this Owner
Home Financials are based on the most recent Mortgage that was taken out on this home.
Original Mortgage
$247,500
Outstanding Balance
$242,066
Interest Rate
3.64%
Mortgage Type
Reverse Mortgage Home Equity Conversion Mortgage
Estimated Equity
$6,698
Purchase Details
Closed on
Oct 17, 2008
Sold by
Hoyer John and Hoyer Jill
Bought by
Gordon Joyce E and Judd Joyce E
Purchase Details
Closed on
May 27, 2005
Sold by
Scheerschmidt Fred I and Scheerschmidt Joyce A
Bought by
Judd Joyce E and Hoyer John
Purchase Details
Closed on
Sep 22, 2004
Sold by
Dumbauld Irene P
Bought by
Scheerschmidt Fred I and Scheerschmidt Joyce A
Create a Home Valuation Report for This Property
The Home Valuation Report is an in-depth analysis detailing your home's value as well as a comparison with similar homes in the area
Home Values in the Area
Average Home Value in this Area
Purchase History
| Date | Buyer | Sale Price | Title Company |
|---|---|---|---|
| Hoyer John E | -- | Fnc Title Services Llc | |
| Gordon Joyce E | -- | Attorney | |
| Judd Joyce E | $151,500 | -- | |
| Scheerschmidt Fred I | $135,000 | -- |
Source: Public Records
Mortgage History
| Date | Status | Borrower | Loan Amount |
|---|---|---|---|
| Open | Hoyer John E | $247,500 |
Source: Public Records
Tax History Compared to Growth
Tax History
| Year | Tax Paid | Tax Assessment Tax Assessment Total Assessment is a certain percentage of the fair market value that is determined by local assessors to be the total taxable value of land and additions on the property. | Land | Improvement |
|---|---|---|---|---|
| 2024 | $2,208 | $62,750 | $12,340 | $50,410 |
| 2023 | $2,208 | $62,750 | $12,340 | $50,410 |
| 2022 | $1,829 | $46,140 | $7,710 | $38,430 |
| 2021 | $1,854 | $46,140 | $7,710 | $38,430 |
| 2020 | $1,774 | $46,140 | $7,710 | $38,430 |
| 2019 | $1,940 | $47,240 | $8,740 | $38,500 |
| 2018 | $1,948 | $47,240 | $8,740 | $38,500 |
| 2017 | $1,729 | $47,240 | $8,740 | $38,500 |
| 2016 | $1,730 | $42,310 | $8,740 | $33,570 |
| 2015 | $1,734 | $42,310 | $8,740 | $33,570 |
| 2014 | $1,659 | $42,310 | $8,740 | $33,570 |
Source: Public Records
Map
Nearby Homes
- 659 N King St
- 508 Marshall Dr
- 479 N Stadium Dr
- 348 S Stadium Dr
- 513 Redbud Ln
- 878 N Detroit St
- 516 N King St
- 902 N Detroit St
- 568 Louise Dr
- 119 Park Dr
- 613 N West St
- 137 Pleasant St
- 610 Saxony Dr
- 1038 Frederick Dr
- 656 Eden Roc Dr
- 1171 N Detroit St
- 645 E Church St
- 612 E Market St
- 541 E Main St
- 607 E Main St
- 718 N Monroe Dr
- 748 N Monroe Dr
- 659 Sutton Dr
- 673 Sutton Dr
- 689 Sutton Dr
- 641 Sutton Dr
- 700 N Monroe Dr
- 764 N Monroe Dr
- 735 N Monroe Dr
- 717 N Monroe Dr
- 755 N Monroe Dr
- 707 Sutton Dr
- 629 Sutton Dr
- 701 N Monroe Dr
- 680 N Monroe Dr
- 784 N Monroe Dr
- 771 N Monroe Dr
- 699 Smith Ave
- 721 Sutton Dr
- 698 Smith Ave