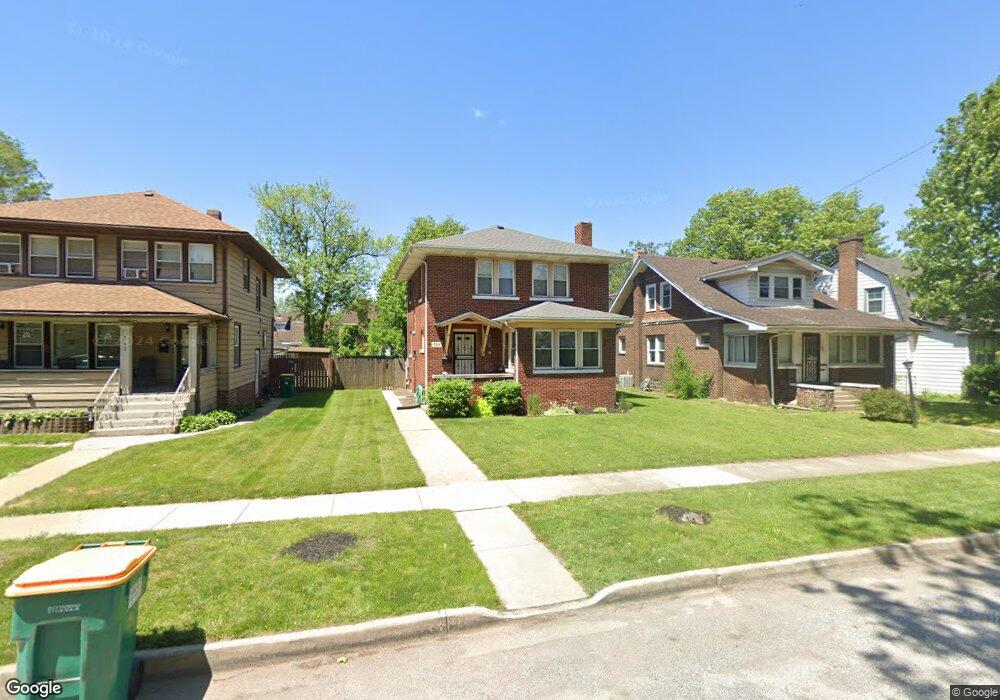
734 Pierce St Gary, IN 46402
Downtown Gary NeighborhoodEstimated Value: $99,000 - $198,000
4
Beds
2
Baths
2,112
Sq Ft
$73/Sq Ft
Est. Value
About This Home
This home is located at 734 Pierce St, Gary, IN 46402 and is currently estimated at $153,383, approximately $72 per square foot. 734 Pierce St is a home located in Lake County with nearby schools including Beveridge Elementary School, Gary Middle School, and West Side Leadership Academy.
Ownership History
Date
Name
Owned For
Owner Type
Purchase Details
Closed on
Sep 29, 2006
Sold by
Gary Citywide Development Corp
Bought by
Ceaser Rachelle Morgan
Current Estimated Value
Home Financials for this Owner
Home Financials are based on the most recent Mortgage that was taken out on this home.
Original Mortgage
$95,556
Outstanding Balance
$57,115
Interest Rate
6.49%
Mortgage Type
Purchase Money Mortgage
Estimated Equity
$96,268
Purchase Details
Closed on
May 9, 2005
Sold by
Joiner Bill and Jackson Family Trust
Bought by
Gary Citywide Development Corp
Create a Home Valuation Report for This Property
The Home Valuation Report is an in-depth analysis detailing your home's value as well as a comparison with similar homes in the area
Home Values in the Area
Average Home Value in this Area
Purchase History
| Date | Buyer | Sale Price | Title Company |
|---|---|---|---|
| Ceaser Rachelle Morgan | -- | Ticor Mo | |
| Gary Citywide Development Corp | -- | Ticor |
Source: Public Records
Mortgage History
| Date | Status | Borrower | Loan Amount |
|---|---|---|---|
| Open | Ceaser Rachelle Morgan | $95,556 |
Source: Public Records
Tax History Compared to Growth
Tax History
| Year | Tax Paid | Tax Assessment Tax Assessment Total Assessment is a certain percentage of the fair market value that is determined by local assessors to be the total taxable value of land and additions on the property. | Land | Improvement |
|---|---|---|---|---|
| 2024 | $10,413 | $126,000 | $7,300 | $118,700 |
| 2023 | $1,463 | $118,100 | $7,100 | $111,000 |
| 2022 | $1,463 | $120,400 | $4,500 | $115,900 |
| 2021 | $1,334 | $111,000 | $4,500 | $106,500 |
| 2020 | $1,359 | $112,800 | $4,500 | $108,300 |
| 2019 | $1,128 | $106,800 | $4,500 | $102,300 |
| 2018 | $1,107 | $100,700 | $4,300 | $96,400 |
| 2017 | $1,138 | $102,300 | $4,300 | $98,000 |
| 2016 | $1,179 | $107,000 | $4,300 | $102,700 |
| 2014 | $1,215 | $111,400 | $5,300 | $106,100 |
| 2013 | $927 | $109,100 | $5,300 | $103,800 |
Source: Public Records
Map
Nearby Homes
- 743 Buchanan St
- 749 Buchanan St
- 733 Lincoln St
- 823 Pierce St
- 642 Fillmore St
- 817 Fillmore St
- 640 Polk St
- 851 Johnson St
- 824 Johnson St
- 833 Tyler St
- 604 Harrison St
- 1040 Polk St
- 552 Harrison St
- 1052 Tyler St
- 537 Harrison St
- 435 Buchanan St Unit 46402
- 700 Jackson St
- 1825 W 7th Ave
- 1109 W 11th Ave
- 571 Van Buren St