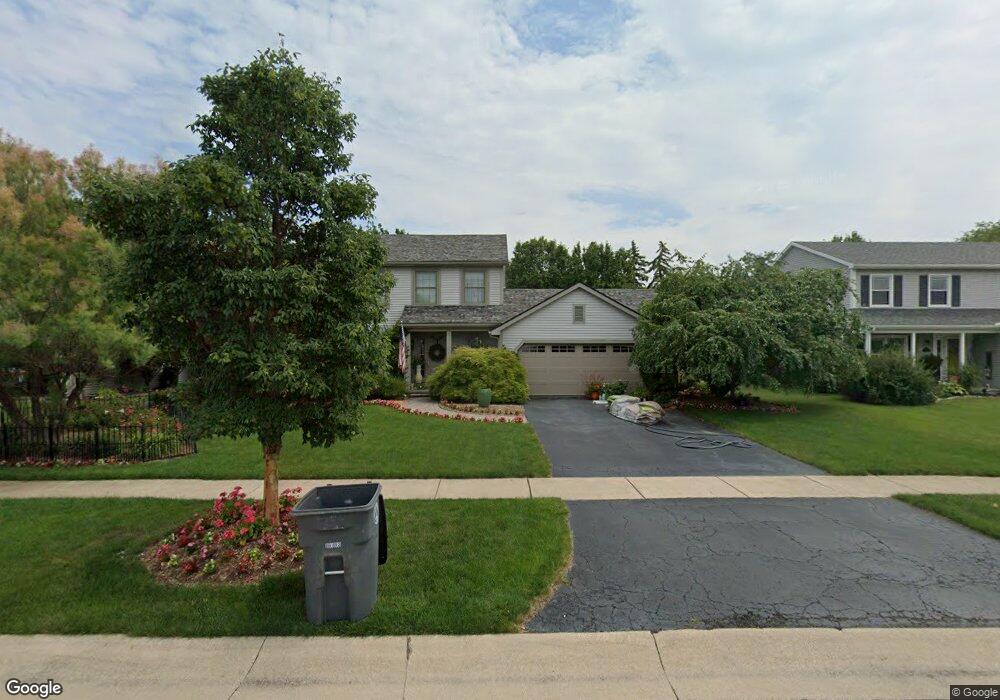
734 Streamview Dr Perrysburg, OH 43551
Estimated Value: $308,998 - $330,000
3
Beds
3
Baths
1,620
Sq Ft
$196/Sq Ft
Est. Value
About This Home
This home is located at 734 Streamview Dr, Perrysburg, OH 43551 and is currently estimated at $317,250, approximately $195 per square foot. 734 Streamview Dr is a home located in Wood County with nearby schools including Frank Elementary School, Perrysburg Junior High School, and Perrysburg High School.
Ownership History
Date
Name
Owned For
Owner Type
Purchase Details
Closed on
Jul 12, 2012
Sold by
Szymanowski John A and Szymanowski Patricia A
Bought by
Szymanowski John A and Szymanowski Patricia A
Current Estimated Value
Purchase Details
Closed on
Apr 27, 2012
Sold by
Szymanowski John A and Szymanowski Patricia A
Bought by
Szymanowski John A and Szymanowski Patricia A
Purchase Details
Closed on
Dec 4, 2008
Sold by
Szymanowski John A and Quate Patricia A
Bought by
Szymanowski John A and Szymanowski Patricia A
Purchase Details
Closed on
Aug 18, 1997
Sold by
Key Trust Co Of Ohio
Bought by
Szymanowski John A and Quate Patricia A
Home Financials for this Owner
Home Financials are based on the most recent Mortgage that was taken out on this home.
Original Mortgage
$119,600
Interest Rate
7.63%
Mortgage Type
New Conventional
Create a Home Valuation Report for This Property
The Home Valuation Report is an in-depth analysis detailing your home's value as well as a comparison with similar homes in the area
Home Values in the Area
Average Home Value in this Area
Purchase History
| Date | Buyer | Sale Price | Title Company |
|---|---|---|---|
| Szymanowski John A | -- | None Available | |
| Szymanowski John A | -- | None Available | |
| Szymanowski John A | -- | Attorney | |
| Szymanowski John A | $33,900 | -- |
Source: Public Records
Mortgage History
| Date | Status | Borrower | Loan Amount |
|---|---|---|---|
| Previous Owner | Szymanowski John A | $119,600 |
Source: Public Records
Tax History
| Year | Tax Paid | Tax Assessment Tax Assessment Total Assessment is a certain percentage of the fair market value that is determined by local assessors to be the total taxable value of land and additions on the property. | Land | Improvement |
|---|---|---|---|---|
| 2025 | $4,596 | $82,530 | $16,345 | $66,185 |
| 2024 | $4,799 | $82,530 | $16,345 | $66,185 |
| 2023 | $4,799 | $82,540 | $16,350 | $66,190 |
| 2021 | $4,201 | $66,580 | $14,320 | $52,260 |
| 2020 | $4,177 | $66,580 | $14,320 | $52,260 |
| 2019 | $3,742 | $57,860 | $14,320 | $43,540 |
| 2018 | $3,326 | $57,860 | $14,320 | $43,540 |
| 2017 | $3,134 | $57,860 | $14,320 | $43,540 |
| 2016 | $3,077 | $51,530 | $14,320 | $37,210 |
| 2015 | $3,077 | $51,530 | $14,320 | $37,210 |
| 2014 | $3,098 | $51,530 | $14,320 | $37,210 |
| 2013 | $3,169 | $51,530 | $14,320 | $37,210 |
Source: Public Records
Map
Nearby Homes
- 384 Southwood Dr
- 832 Turnbury Ln Unit 28
- 1037 Turnbury Ln Unit 1037
- 180 Southwood Dr
- 14 Hawthorne Crossing
- 1073 Westbrook Dr
- 1011 Cherry St
- 1002 Walnut St
- 160 Quail Rd
- 541 Mallard Rd
- 11037 Bay Trace Dr
- 318 Birchdale Rd
- 955 Louisiana Ave
- 872 Cherry St
- 12378 Lincoln Blvd
- 333 W 7th St
- 26374 Emerald Lakes Dr
- 429 W 5th St
- 25854 McCutcheonville Rd
- 1435 Indian Creek Dr
- 748 Streamview Dr
- 348 Southwood Dr
- 352 Southwood Dr
- 762 Streamview Dr
- 706 Streamview Dr
- 344 Southwood Dr
- 356 Southwood Dr
- 731 Streamview Dr
- 715 Streamview Dr
- 340 Southwood Dr
- 745 Streamview Dr
- 776 Streamview Dr
- 360 Southwood Dr
- 759 Streamview Dr
- 681 Streamview Dr
- 692 Streamview Dr
- 336 Southwood Dr
- 366 Southwood Dr
- 790 Streamview Dr
- 805 Streamview Dr
Your Personal Tour Guide
Ask me questions while you tour the home.