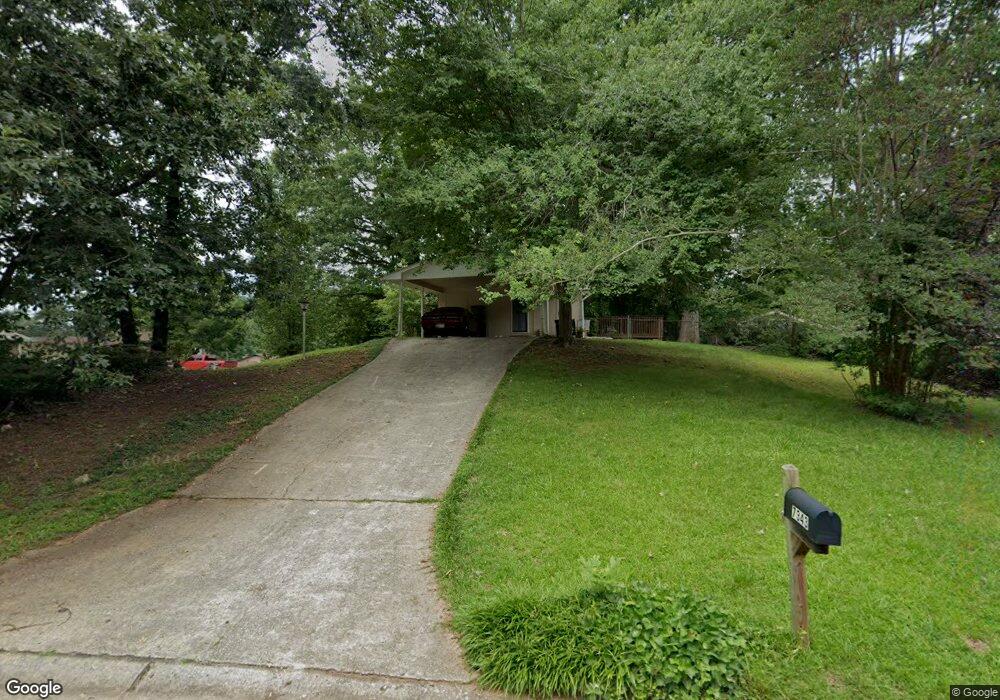
7343 Mockingbird Ct Riverdale, GA 30274
Estimated Value: $148,000 - $272,000
3
Beds
2
Baths
1,851
Sq Ft
$115/Sq Ft
Est. Value
About This Home
This home is located at 7343 Mockingbird Ct, Riverdale, GA 30274 and is currently estimated at $213,630, approximately $115 per square foot. 7343 Mockingbird Ct is a home located in Clayton County with nearby schools including Kilpatrick Elementary School, Sequoyah Middle School, and Charles R. Drew High School.
Ownership History
Date
Name
Owned For
Owner Type
Purchase Details
Closed on
Sep 23, 2013
Sold by
Scott Allen D
Bought by
Rha 1 Llc
Current Estimated Value
Purchase Details
Closed on
Nov 30, 2011
Sold by
Crm Central Properties Llc
Bought by
Scott Allen D
Purchase Details
Closed on
Apr 26, 2007
Sold by
Fannie Mae
Bought by
Banjos Properties Llc
Home Financials for this Owner
Home Financials are based on the most recent Mortgage that was taken out on this home.
Original Mortgage
$79,179
Interest Rate
6.1%
Mortgage Type
New Conventional
Purchase Details
Closed on
Nov 7, 2006
Sold by
Chase Home Fin Llc
Bought by
Federal National Mortgage Association
Purchase Details
Closed on
Apr 30, 2004
Sold by
O'Neill Linda
Bought by
Oneill Sabrina L
Create a Home Valuation Report for This Property
The Home Valuation Report is an in-depth analysis detailing your home's value as well as a comparison with similar homes in the area
Home Values in the Area
Average Home Value in this Area
Purchase History
| Date | Buyer | Sale Price | Title Company |
|---|---|---|---|
| Rha 1 Llc | $40,000 | -- | |
| Scott Allen D | $18,000 | -- | |
| Banjos Properties Llc | -- | -- | |
| Federal National Mortgage Association | -- | -- | |
| Chase Home Fin Llc | $94,981 | -- | |
| Oneill Sabrina L | -- | -- |
Source: Public Records
Mortgage History
| Date | Status | Borrower | Loan Amount |
|---|---|---|---|
| Previous Owner | Banjos Properties Llc | $79,179 |
Source: Public Records
Tax History
| Year | Tax Paid | Tax Assessment Tax Assessment Total Assessment is a certain percentage of the fair market value that is determined by local assessors to be the total taxable value of land and additions on the property. | Land | Improvement |
|---|---|---|---|---|
| 2025 | $2,872 | $75,000 | $6,400 | $68,600 |
| 2024 | $2,673 | $68,520 | $6,400 | $62,120 |
| 2023 | $2,481 | $68,720 | $6,400 | $62,320 |
| 2022 | $2,273 | $57,920 | $6,400 | $51,520 |
| 2021 | $1,820 | $46,080 | $6,400 | $39,680 |
| 2020 | $1,402 | $35,058 | $6,400 | $28,658 |
| 2019 | $1,190 | $29,314 | $3,200 | $26,114 |
| 2018 | $1,058 | $26,056 | $3,200 | $22,856 |
| 2017 | $819 | $20,121 | $3,200 | $16,921 |
| 2016 | $843 | $20,728 | $3,200 | $17,528 |
| 2015 | $839 | $0 | $0 | $0 |
| 2014 | $636 | $16,000 | $3,200 | $12,800 |
Source: Public Records
Map
Nearby Homes
- 7428 Mockingbird Trail
- 213 Whipporwill Way
- 235 Montego Cir
- 514 Clara Dr Unit 1
- 7582 Smith Ct
- 7062 Sir Galahad Way
- 521 Fielding Cir
- 371 Chase Woods Cir
- 583 Fielding Cir
- 687 Anderson Dr
- 112 Rivercrest Dr
- 7725 Newbury Dr
- 9398 Maple Dr
- 7288 Howard Cir
- 7476 Ledgestone Ln
- 9398 Maple Grove Ln
- 9398 Maple Grove Ln Unit 39
- 9439 Maple Grove Ln Unit LOT 268
- 727 S Carter Dr
- 7336 Howard Cir
- 7343 Mockingbird Ct
- 7343 Mockingbird Ct Unit 7343
- 7343 Mockingbird Ct
- 7333 Mockingbird Ct
- 7342 Ovis Ln
- 7332 Ovis Ln
- 7381 Mockingbird Trail
- 7325 Mockingbird Ct
- 7385 Mockingbird Trail
- 7377 Mockingbird Trail
- 7344 Mockingbird Trail
- 1313 Mockingbird Lane Rd E Unit 2141
- 1313 Mockingbird Lane Rd E
- 7326 Ovis Ln
- 7334 Mockingbird Ct
- 7334 Mockingbird Ct Unit 7334
- 7334 Mockingbird Ct
- 7389 Mockingbird Trail
- 7373 Mockingbird Trail
- 7319 Mockingbird Ct
Your Personal Tour Guide
Ask me questions while you tour the home.