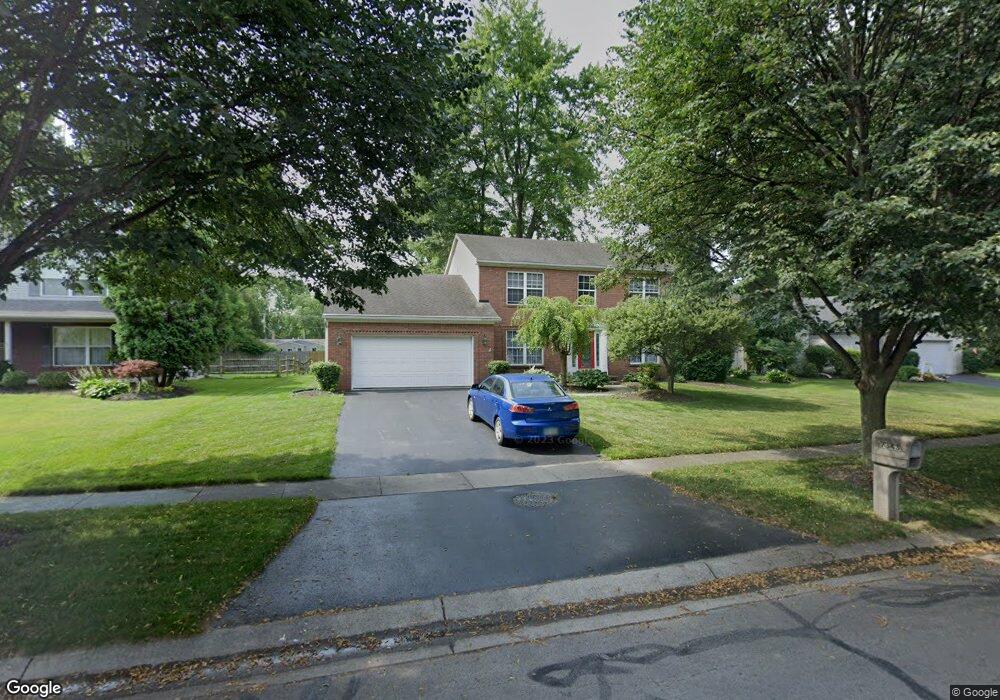
7343 Yunker Ln Holland, OH 43528
Estimated Value: $373,301 - $402,000
4
Beds
3
Baths
2,145
Sq Ft
$182/Sq Ft
Est. Value
About This Home
This home is located at 7343 Yunker Ln, Holland, OH 43528 and is currently estimated at $391,325, approximately $182 per square foot. 7343 Yunker Ln is a home located in Lucas County with nearby schools including Holland Elementary School, Springfield Middle School, and Springfield High School.
Ownership History
Date
Name
Owned For
Owner Type
Purchase Details
Closed on
Nov 4, 2011
Sold by
Tulenson Eric D and Tulenson Mara M
Bought by
Kirlin Paul J and Kirlin Juliann
Current Estimated Value
Home Financials for this Owner
Home Financials are based on the most recent Mortgage that was taken out on this home.
Original Mortgage
$186,644
Outstanding Balance
$129,585
Interest Rate
4.4%
Mortgage Type
FHA
Estimated Equity
$261,740
Purchase Details
Closed on
Oct 1, 2008
Sold by
Tulenson Eric D and Tulenson Mara M
Bought by
Tulenson Eric D and Tulenson Mara M
Purchase Details
Closed on
Jul 24, 2002
Sold by
J Moses Construction Ltd
Bought by
Tulenson Eric D and Tulenson Mara M
Home Financials for this Owner
Home Financials are based on the most recent Mortgage that was taken out on this home.
Original Mortgage
$163,900
Interest Rate
6.8%
Mortgage Type
Balloon
Create a Home Valuation Report for This Property
The Home Valuation Report is an in-depth analysis detailing your home's value as well as a comparison with similar homes in the area
Home Values in the Area
Average Home Value in this Area
Purchase History
| Date | Buyer | Sale Price | Title Company |
|---|---|---|---|
| Kirlin Paul J | $191,500 | Area Title Agency | |
| Tulenson Eric D | -- | Attorney | |
| Tulenson Eric D | $204,900 | Louisville Title Agency For |
Source: Public Records
Mortgage History
| Date | Status | Borrower | Loan Amount |
|---|---|---|---|
| Open | Kirlin Paul J | $186,644 | |
| Previous Owner | Tulenson Eric D | $163,900 |
Source: Public Records
Tax History Compared to Growth
Tax History
| Year | Tax Paid | Tax Assessment Tax Assessment Total Assessment is a certain percentage of the fair market value that is determined by local assessors to be the total taxable value of land and additions on the property. | Land | Improvement |
|---|---|---|---|---|
| 2024 | $2,740 | $109,515 | $17,990 | $91,525 |
| 2023 | $5,659 | $96,215 | $15,225 | $80,990 |
| 2022 | $5,667 | $96,215 | $15,225 | $80,990 |
| 2021 | $5,672 | $96,215 | $15,225 | $80,990 |
| 2020 | $5,172 | $78,960 | $12,320 | $66,640 |
| 2019 | $5,040 | $78,960 | $12,320 | $66,640 |
| 2018 | $4,911 | $78,960 | $12,320 | $66,640 |
| 2017 | $4,820 | $70,665 | $10,920 | $59,745 |
| 2016 | $4,873 | $201,900 | $31,200 | $170,700 |
| 2015 | $4,863 | $201,900 | $31,200 | $170,700 |
| 2014 | $4,409 | $68,610 | $10,610 | $58,000 |
| 2013 | $4,409 | $68,610 | $10,610 | $58,000 |
Source: Public Records
Map
Nearby Homes
- 820 Weatherstone Rd
- 7331 Witherby Ct
- 1054 Clark St
- 1051 Wentworth St
- 7139 Springfield Dr
- 7256 Apache Trail
- 7717 Angola Rd Unit 151
- 134 Deerfield Dr
- 1421 Maumee St
- 508 Crystal Lake Dr
- 217 Pebble Beach Dr
- 7920 N Shoreline Dr
- 7238 Lilac Ct
- 427 S Mccord Rd
- 343 S Mccord Rd
- 7709 Fountain Dr
- 642 Diana Dr
- 8006 Cove Harbour Dr N
- 324 Harefoote St
- 352 Cheswick St
- 7335 Yunker Ln
- 836 Weatherstone Rd
- 828 Weatherstone Rd
- 7340 Angola Rd
- 811 Weatherstone Rd
- 7332 Yunker Ln
- 7319 Yunker Ln
- 7332 Angola Rd
- 7324 Yunker Ln
- 7360 Angola Rd
- 814 Weatherstone Rd
- 803 Weatherstone Rd
- 842 Whisperwood Pkwy
- 7307 Yunker Ln
- 7316 Yunker Ln
- 806 Weatherstone Rd
- 850 Whisperwood Pkwy
- 755 Weatherstone Rd
- 778 Hammersmith Cir
- 770 Hammersmith Cir