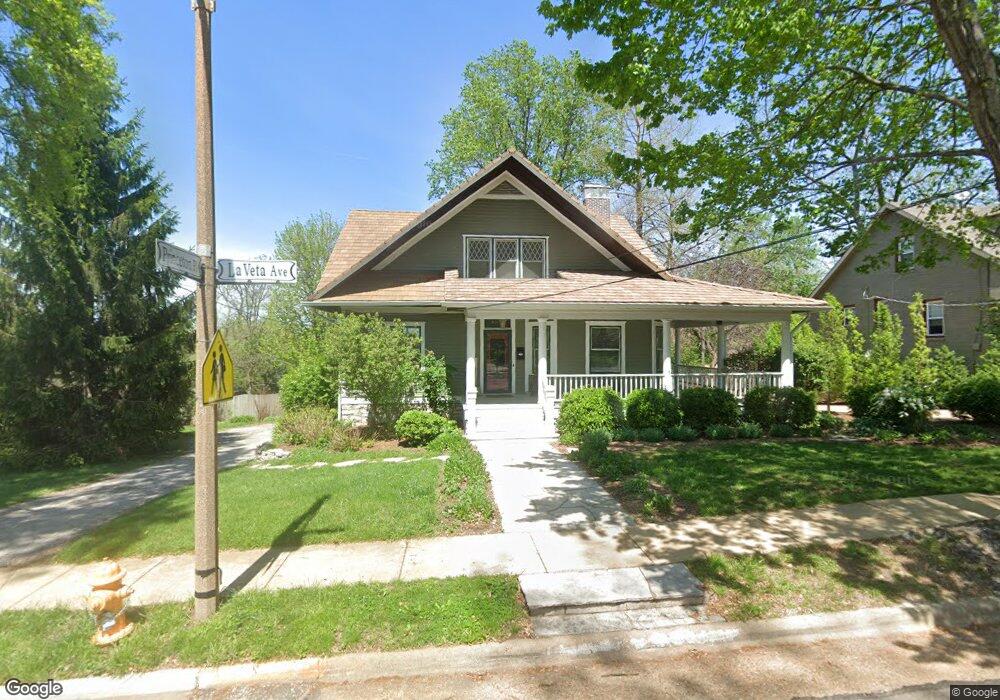
7345 La Veta Ave Saint Louis, MO 63117
Estimated Value: $527,002 - $728,000
5
Beds
2
Baths
2,770
Sq Ft
$215/Sq Ft
Est. Value
About This Home
This home is located at 7345 La Veta Ave, Saint Louis, MO 63117 and is currently estimated at $596,751, approximately $215 per square foot. 7345 La Veta Ave is a home located in St. Louis County with nearby schools including Maplewood Richmond Heights Elementary School, Maplewood Richmond Heights Middle School, and Maplewood-Richmond Heights High School.
Ownership History
Date
Name
Owned For
Owner Type
Purchase Details
Closed on
Dec 4, 2021
Sold by
Fuoss and Melissa
Bought by
Joel M Fuoss And Melissa A Fuoss Joint Marita and Fuo Melissa
Current Estimated Value
Purchase Details
Closed on
Apr 26, 2019
Sold by
Tonella Christopher M and Tonella Meredith
Bought by
Fuoss Joel and Fuoss Melissa
Home Financials for this Owner
Home Financials are based on the most recent Mortgage that was taken out on this home.
Original Mortgage
$412,000
Interest Rate
4.3%
Mortgage Type
New Conventional
Purchase Details
Closed on
Apr 6, 2001
Sold by
Hargate Elra B
Bought by
Tonella Christopher M and Tonella Meredith
Home Financials for this Owner
Home Financials are based on the most recent Mortgage that was taken out on this home.
Original Mortgage
$180,400
Interest Rate
7.13%
Create a Home Valuation Report for This Property
The Home Valuation Report is an in-depth analysis detailing your home's value as well as a comparison with similar homes in the area
Home Values in the Area
Average Home Value in this Area
Purchase History
| Date | Buyer | Sale Price | Title Company |
|---|---|---|---|
| Joel M Fuoss And Melissa A Fuoss Joint Marita | -- | None Listed On Document | |
| Fuoss Joel | -- | Old Republic Natl Ins Ttl Co | |
| Tonella Christopher M | $186,000 | -- | |
| Tonella Christopher M | $186,000 | -- |
Source: Public Records
Mortgage History
| Date | Status | Borrower | Loan Amount |
|---|---|---|---|
| Previous Owner | Fuoss Joel | $412,000 | |
| Previous Owner | Tonella Christopher M | $180,400 |
Source: Public Records
Tax History Compared to Growth
Tax History
| Year | Tax Paid | Tax Assessment Tax Assessment Total Assessment is a certain percentage of the fair market value that is determined by local assessors to be the total taxable value of land and additions on the property. | Land | Improvement |
|---|---|---|---|---|
| 2025 | $6,248 | $89,850 | $44,690 | $45,160 |
| 2024 | $6,248 | $81,830 | $23,310 | $58,520 |
| 2023 | $6,248 | $81,830 | $23,310 | $58,520 |
| 2022 | $5,782 | $70,570 | $27,970 | $42,600 |
| 2021 | $5,681 | $70,570 | $27,970 | $42,600 |
| 2020 | $5,815 | $68,510 | $27,090 | $41,420 |
| 2019 | $5,770 | $68,510 | $27,090 | $41,420 |
| 2018 | $4,832 | $52,000 | $13,430 | $38,570 |
| 2017 | $4,799 | $52,000 | $13,430 | $38,570 |
| 2016 | $3,834 | $39,990 | $12,480 | $27,510 |
| 2015 | $3,603 | $39,990 | $12,480 | $27,510 |
| 2014 | $4,819 | $53,670 | $12,670 | $41,000 |
Source: Public Records
Map
Nearby Homes
- 7400 Williams Ave
- 2024 Bellevue Ave
- 7129 Glades Ave
- 7342 Dale Ave
- 1338 Sunset Ave
- 2029 Blendon Place
- 2049 Blendon Place
- 7027 Plateau Ave
- 2010 Blendon Place
- 1723 Mccready Ave
- 7264 Richmond Place
- 2117 Yale Ave
- 2213 Yale Ave
- 7590 W Bruno Ave
- 2052 Mccausland Ave
- 7555 Alicia Ave
- 2118 Mccausland Ave
- 7315 Wise Ave
- 2030 Bland Place
- 1925 Forest Ave
- 7339 La Veta Ave
- 7347 La Veta Ave
- 7353 La Veta Ave
- 7331 La Veta Ave
- 7336 Arlington Dr
- 7338 Arlington Dr
- 1610 Hunter Ave
- 7330 Arlington Dr
- 7344 Arlington Dr
- 7352 La Veta Ave
- 7340 La Veta Ave
- 7350 Arlington Dr
- 7354 Arlington Dr
- 7358 La Veta Ave
- 7326 Arlington Dr
- 7346 Arlington Dr
- 7327 La Veta Ave
- 7363 La Veta Ave
- 1608 Hunter Ave
- 7362 La Veta Ave