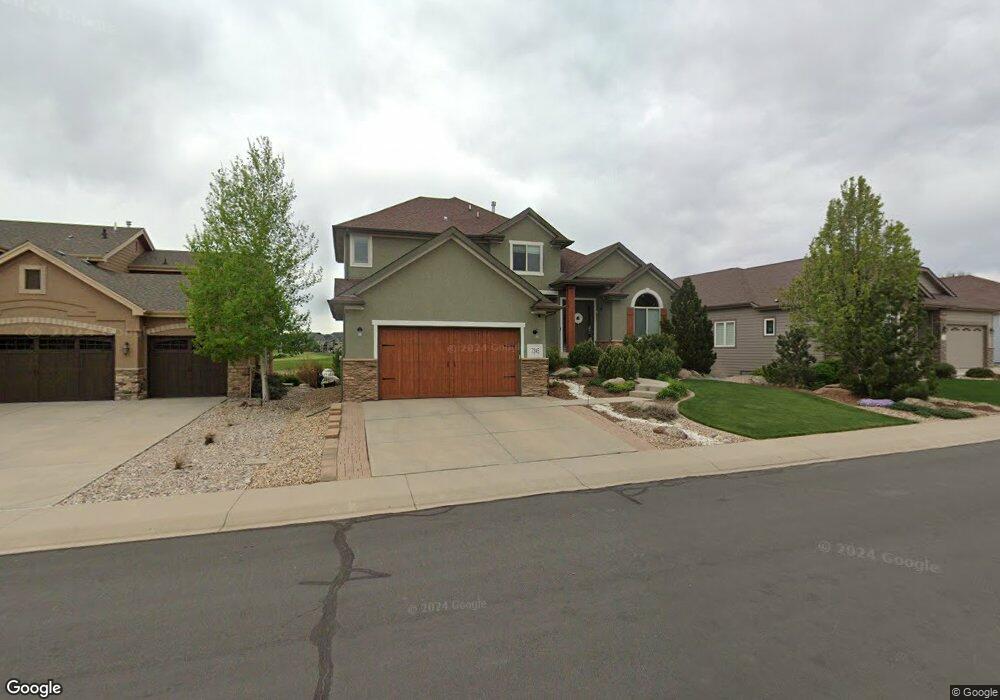
7345 Royal Country Down Dr Windsor, CO 80550
Estimated Value: $1,235,546 - $1,394,000
5
Beds
5
Baths
4,787
Sq Ft
$279/Sq Ft
Est. Value
About This Home
This home is located at 7345 Royal Country Down Dr, Windsor, CO 80550 and is currently estimated at $1,334,137, approximately $278 per square foot. 7345 Royal Country Down Dr is a home located in Larimer County with nearby schools including Colorado Early Colleges Windsor, Westgate KinderCare, and Resurrection Christian School.
Ownership History
Date
Name
Owned For
Owner Type
Purchase Details
Closed on
Mar 3, 2011
Sold by
Anderson William M and Anderson Rhonda L
Bought by
Holzner Joakim A and Holzner Melanie R
Current Estimated Value
Home Financials for this Owner
Home Financials are based on the most recent Mortgage that was taken out on this home.
Original Mortgage
$417,000
Outstanding Balance
$286,385
Interest Rate
4.78%
Mortgage Type
New Conventional
Estimated Equity
$1,047,752
Purchase Details
Closed on
Nov 2, 2009
Sold by
Specketer Lance D and Specketer Kristen A
Bought by
Anderson William M and Anderson Rhonda L
Purchase Details
Closed on
Aug 7, 2007
Sold by
Classic Custom Builders Inc
Bought by
Specketer Lance D and Specketer Kristen A
Home Financials for this Owner
Home Financials are based on the most recent Mortgage that was taken out on this home.
Original Mortgage
$468,000
Interest Rate
6.69%
Mortgage Type
Construction
Create a Home Valuation Report for This Property
The Home Valuation Report is an in-depth analysis detailing your home's value as well as a comparison with similar homes in the area
Home Values in the Area
Average Home Value in this Area
Purchase History
| Date | Buyer | Sale Price | Title Company |
|---|---|---|---|
| Holzner Joakim A | $620,000 | Tggt | |
| Anderson William M | $558,556 | Tggt | |
| Specketer Lance D | $115,000 | Chicago Title Co | |
| Classic Custom Builders Inc | $105,000 | Commonwealth Title |
Source: Public Records
Mortgage History
| Date | Status | Borrower | Loan Amount |
|---|---|---|---|
| Open | Holzner Joakim A | $417,000 | |
| Previous Owner | Specketer Lance D | $468,000 |
Source: Public Records
Tax History Compared to Growth
Tax History
| Year | Tax Paid | Tax Assessment Tax Assessment Total Assessment is a certain percentage of the fair market value that is determined by local assessors to be the total taxable value of land and additions on the property. | Land | Improvement |
|---|---|---|---|---|
| 2025 | $11,177 | $78,511 | $20,904 | $57,607 |
| 2024 | $10,832 | $78,511 | $20,904 | $57,607 |
| 2022 | $8,276 | $56,858 | $15,158 | $41,700 |
| 2021 | $8,396 | $58,494 | $15,594 | $42,900 |
| 2020 | $7,494 | $51,888 | $11,440 | $40,448 |
| 2019 | $7,513 | $51,888 | $11,440 | $40,448 |
| 2018 | $7,176 | $52,178 | $10,634 | $41,544 |
| 2017 | $7,167 | $52,178 | $10,634 | $41,544 |
| 2016 | $7,324 | $53,133 | $9,154 | $43,979 |
| 2015 | $7,262 | $53,130 | $9,150 | $43,980 |
| 2014 | $6,292 | $45,630 | $7,160 | $38,470 |
Source: Public Records
Map
Nearby Homes
- 6682 Crooked Stick Dr
- 6325 Sanctuary Dr
- 6558 Murano Dr
- 6787 Spanish Bay Dr
- 6634 Crystal Downs Dr Unit 103
- 6671 Spanish Bay Dr
- 6690 Crystal Downs Dr Unit 205
- 6618 Crystal Downs Dr Unit 201
- 5954 Black Lion Ct
- 6582 Crystal Downs Dr Unit 102
- 5849 Crooked Stick Dr
- 7880 Cherry Blossom Dr
- 6228 Vernazza Way Unit 2
- 6228 Vernazza Way Unit 3
- 6510 Crystal Downs Dr Unit 206
- 6510 Crystal Downs Dr Unit 202
- 8264 Scenic Ridge Ct
- Belmar Plan at Vernazza
- Carolina Plan at Vernazza
- Duxbury Plan at Vernazza
- 7321 Royal Country Down Dr
- 7355 Royal Country Down Dr
- 7285 Royal Country Down Dr
- 7375 Royal Country Down Dr
- 7350 Royal Country Down Dr
- 7265 Royal Country Down Dr
- 7330 Royal Country Down Dr
- 7372 Royal Country Down Dr
- 7392 Royal Country Down Dr
- 7310 Royal Country Down Dr
- 7225 Royal Country Down Dr
- 7286 Royal Country Down Dr
- 7345 Caledonian Ct
- 7325 Caledonian Ct
- 7305 Caledonian Ct
- 7242 Royal Country Down Dr
- 7365 Caledonian Ct
- 7291 Caledonian Ct
- 7205 Royal Country Down Dr
- 7220 Royal Country Down Dr