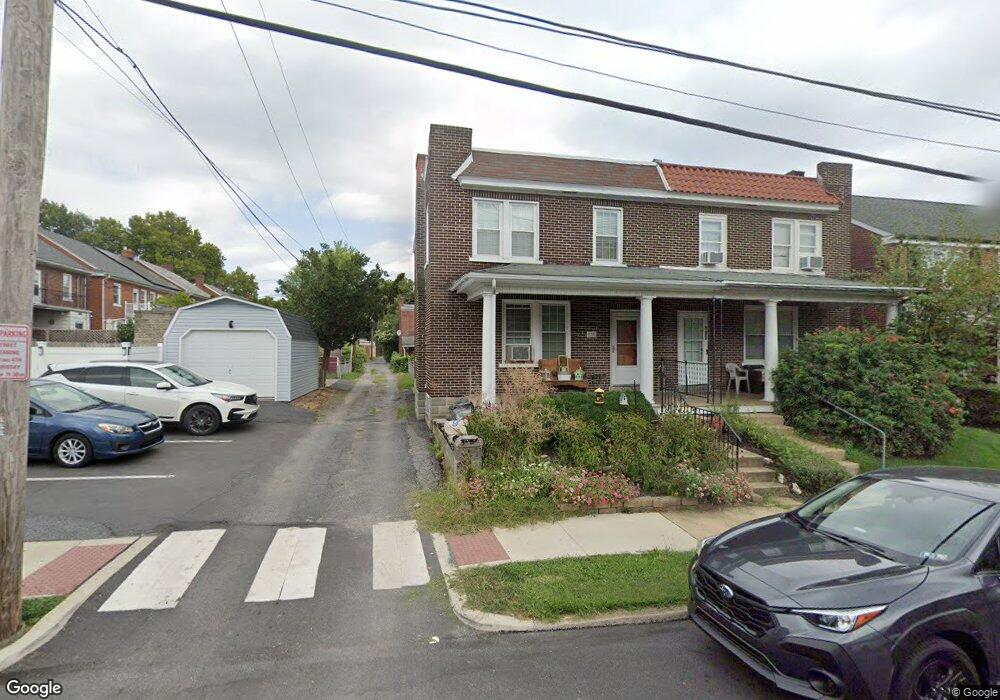
735 4th St Lancaster, PA 17603
West End NeighborhoodEstimated Value: $217,000 - $257,000
3
Beds
1
Bath
1,260
Sq Ft
$192/Sq Ft
Est. Value
About This Home
This home is located at 735 4th St, Lancaster, PA 17603 and is currently estimated at $241,384, approximately $191 per square foot. 735 4th St is a home located in Lancaster County with nearby schools including Smith-Wade-El Elementary School, Wheatland Middle School, and McCaskey High School.
Ownership History
Date
Name
Owned For
Owner Type
Purchase Details
Closed on
Nov 24, 2000
Sold by
Bitts Joseph I and Eby Judy A
Bought by
Disabella Maria P
Current Estimated Value
Home Financials for this Owner
Home Financials are based on the most recent Mortgage that was taken out on this home.
Original Mortgage
$58,969
Outstanding Balance
$21,637
Interest Rate
7.64%
Mortgage Type
FHA
Estimated Equity
$219,747
Create a Home Valuation Report for This Property
The Home Valuation Report is an in-depth analysis detailing your home's value as well as a comparison with similar homes in the area
Home Values in the Area
Average Home Value in this Area
Purchase History
| Date | Buyer | Sale Price | Title Company |
|---|---|---|---|
| Disabella Maria P | $59,000 | -- |
Source: Public Records
Mortgage History
| Date | Status | Borrower | Loan Amount |
|---|---|---|---|
| Open | Disabella Maria P | $58,969 |
Source: Public Records
Tax History
| Year | Tax Paid | Tax Assessment Tax Assessment Total Assessment is a certain percentage of the fair market value that is determined by local assessors to be the total taxable value of land and additions on the property. | Land | Improvement |
|---|---|---|---|---|
| 2025 | $3,704 | $93,600 | $20,400 | $73,200 |
| 2024 | $3,704 | $93,600 | $20,400 | $73,200 |
| 2023 | $3,641 | $93,600 | $20,400 | $73,200 |
| 2022 | $3,490 | $93,600 | $20,400 | $73,200 |
| 2021 | $3,415 | $93,600 | $20,400 | $73,200 |
| 2020 | $3,415 | $93,600 | $20,400 | $73,200 |
| 2019 | $3,364 | $93,600 | $20,400 | $73,200 |
| 2018 | $1,559 | $93,600 | $20,400 | $73,200 |
| 2017 | $3,280 | $71,400 | $15,900 | $55,500 |
| 2016 | $3,250 | $71,400 | $15,900 | $55,500 |
| 2015 | $1,268 | $71,400 | $15,900 | $55,500 |
| 2014 | $2,409 | $71,400 | $15,900 | $55,500 |
Source: Public Records
Map
Nearby Homes
Your Personal Tour Guide
Ask me questions while you tour the home.