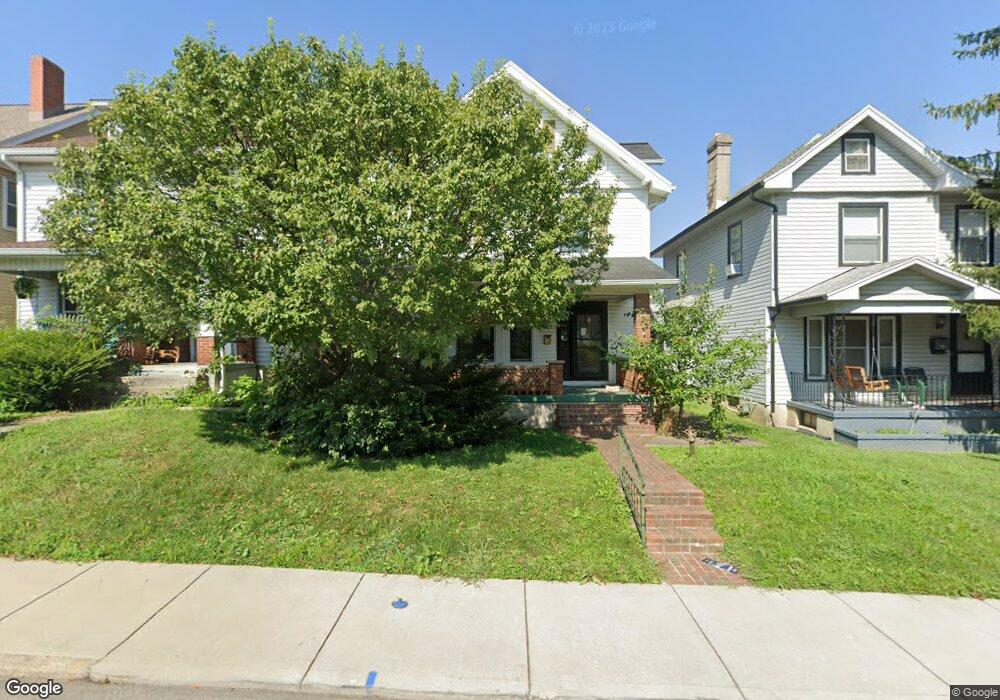
735 Carlisle Ave Dayton, OH 45410
Linden Heights NeighborhoodEstimated Value: $151,000 - $170,030
3
Beds
2
Baths
1,733
Sq Ft
$93/Sq Ft
Est. Value
About This Home
This home is located at 735 Carlisle Ave, Dayton, OH 45410 and is currently estimated at $162,010, approximately $93 per square foot. 735 Carlisle Ave is a home located in Montgomery County with nearby schools including Cleveland Elementary School, Horace Mann Elementary School, and Eastmont Elementary.
Ownership History
Date
Name
Owned For
Owner Type
Purchase Details
Closed on
Jul 19, 2013
Sold by
Evans Jennifer S and Evans Lawrence A
Bought by
Shaffer William R
Current Estimated Value
Home Financials for this Owner
Home Financials are based on the most recent Mortgage that was taken out on this home.
Original Mortgage
$97,042
Outstanding Balance
$70,861
Interest Rate
4.02%
Mortgage Type
VA
Estimated Equity
$91,149
Purchase Details
Closed on
Mar 26, 2009
Sold by
Evans Jennifer S and Dull Jennifer S
Bought by
Evans Jennifer S and Evans Lawrence A
Purchase Details
Closed on
Jun 28, 2005
Sold by
Bare Daniel L and Bare Marcy K
Bought by
Dull Jennifer S
Home Financials for this Owner
Home Financials are based on the most recent Mortgage that was taken out on this home.
Original Mortgage
$82,800
Interest Rate
5.75%
Mortgage Type
Fannie Mae Freddie Mac
Create a Home Valuation Report for This Property
The Home Valuation Report is an in-depth analysis detailing your home's value as well as a comparison with similar homes in the area
Home Values in the Area
Average Home Value in this Area
Purchase History
| Date | Buyer | Sale Price | Title Company |
|---|---|---|---|
| Shaffer William R | $95,000 | Landmark Title Agency South | |
| Evans Jennifer S | -- | Attorney | |
| Dull Jennifer S | $108,300 | -- |
Source: Public Records
Mortgage History
| Date | Status | Borrower | Loan Amount |
|---|---|---|---|
| Open | Shaffer William R | $97,042 | |
| Previous Owner | Dull Jennifer S | $82,800 | |
| Closed | Dull Jennifer S | $19,999 |
Source: Public Records
Tax History Compared to Growth
Tax History
| Year | Tax Paid | Tax Assessment Tax Assessment Total Assessment is a certain percentage of the fair market value that is determined by local assessors to be the total taxable value of land and additions on the property. | Land | Improvement |
|---|---|---|---|---|
| 2024 | $2,627 | $40,970 | $7,180 | $33,790 |
| 2023 | $2,627 | $40,970 | $7,180 | $33,790 |
| 2022 | $2,325 | $26,970 | $4,730 | $22,240 |
| 2021 | $2,237 | $26,970 | $4,730 | $22,240 |
| 2020 | $1,946 | $26,970 | $4,730 | $22,240 |
| 2019 | $2,209 | $27,810 | $3,380 | $24,430 |
| 2018 | $2,212 | $27,810 | $3,380 | $24,430 |
| 2017 | $2,194 | $27,810 | $3,380 | $24,430 |
| 2016 | $2,204 | $26,560 | $3,380 | $23,180 |
| 2015 | $2,083 | $26,560 | $3,380 | $23,180 |
| 2014 | $2,083 | $26,560 | $3,380 | $23,180 |
| 2012 | -- | $18,050 | $5,300 | $12,750 |
Source: Public Records
Map
Nearby Homes
- 2012 Saint Charles Ave
- 662 Carlisle Ave
- 716 Hodapp Ave
- 853 Carlisle Ave
- 630 Carlisle Ave
- 626 Creighton Ave
- 722 Saint Nicholas Ave
- 708 Saint Nicholas Ave
- 621 Creighton Ave
- 607 Carlisle Ave
- 2105 Wyoming St
- 636 Wilfred Ave
- 712 Wellmeier Ave
- 2312 Saint Charles Ave
- 523 Carlisle Ave
- 2316 Wyoming St
- 1708 Xenia Ave
- 624 Pritz Ave
- 133 Linsan Ct
- 914 Linden Ave
- 731 Carlisle Ave
- 739 Carlisle Ave
- 727 Carlisle Ave
- 743 Carlisle Ave
- 723 Carlisle Ave
- 734 Creighton Ave
- 738 Creighton Ave
- 719 Carlisle Ave
- 730 Creighton Ave
- 742 Creighton Ave
- 734 Carlisle Ave
- 738 Carlisle Ave
- 730 Carlisle Ave
- 726 Creighton Ave
- 803 Carlisle Ave
- 742 Carlisle Ave
- 726 Carlisle Ave
- 715 Carlisle Ave
- 722 Creighton Ave
- 722 Carlisle Ave