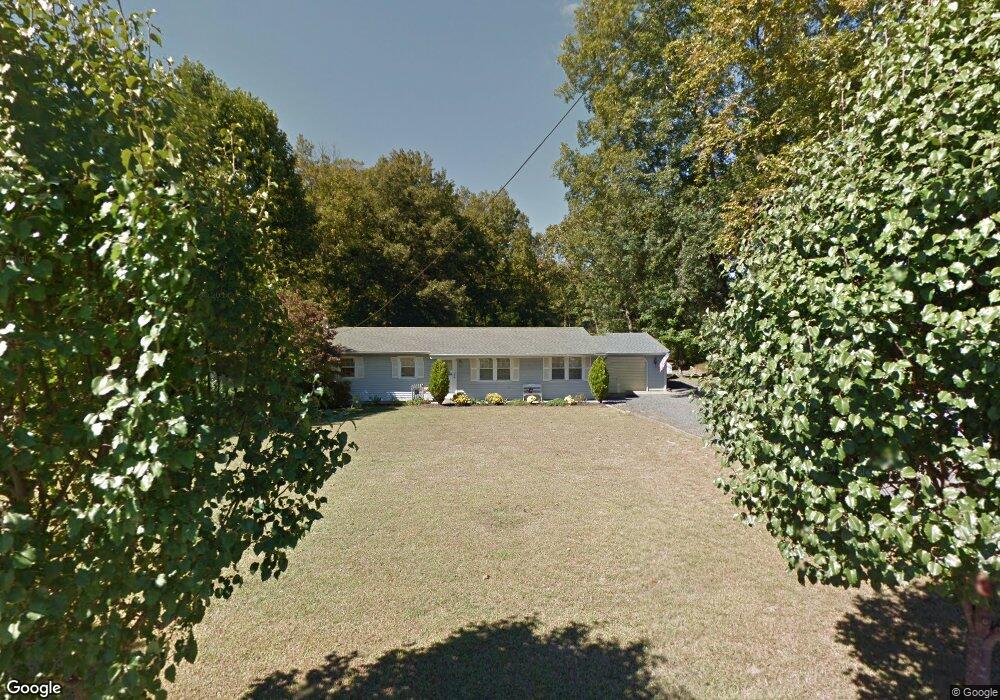
735 Cherry St Southampton, NJ 08088
Estimated Value: $291,649 - $354,000
--
Bed
--
Bath
1,352
Sq Ft
$242/Sq Ft
Est. Value
About This Home
This home is located at 735 Cherry St, Southampton, NJ 08088 and is currently estimated at $327,412, approximately $242 per square foot. 735 Cherry St is a home located in Burlington County with nearby schools including Southampton Twp School No 1, Southampton Twp School No 2, and Southampton Twp School No 3.
Ownership History
Date
Name
Owned For
Owner Type
Purchase Details
Closed on
Feb 3, 2005
Sold by
Schemeley Kenneth C and Schemeley Lisa L
Bought by
Shemeley Kenneth C and Shemely Lisa L
Current Estimated Value
Home Financials for this Owner
Home Financials are based on the most recent Mortgage that was taken out on this home.
Original Mortgage
$173,600
Outstanding Balance
$87,715
Interest Rate
5.66%
Mortgage Type
Fannie Mae Freddie Mac
Estimated Equity
$239,697
Create a Home Valuation Report for This Property
The Home Valuation Report is an in-depth analysis detailing your home's value as well as a comparison with similar homes in the area
Home Values in the Area
Average Home Value in this Area
Purchase History
| Date | Buyer | Sale Price | Title Company |
|---|---|---|---|
| Shemeley Kenneth C | -- | New Vision Title |
Source: Public Records
Mortgage History
| Date | Status | Borrower | Loan Amount |
|---|---|---|---|
| Open | Shemeley Kenneth C | $173,600 |
Source: Public Records
Tax History Compared to Growth
Tax History
| Year | Tax Paid | Tax Assessment Tax Assessment Total Assessment is a certain percentage of the fair market value that is determined by local assessors to be the total taxable value of land and additions on the property. | Land | Improvement |
|---|---|---|---|---|
| 2025 | $5,552 | $168,300 | $60,700 | $107,600 |
| 2024 | $5,347 | $168,300 | $60,700 | $107,600 |
| 2023 | $5,347 | $168,300 | $60,700 | $107,600 |
| 2022 | $5,158 | $168,300 | $60,700 | $107,600 |
| 2021 | $4,826 | $168,300 | $60,700 | $107,600 |
| 2020 | $4,935 | $168,300 | $60,700 | $107,600 |
| 2019 | $4,829 | $168,300 | $60,700 | $107,600 |
| 2018 | $4,716 | $168,300 | $60,700 | $107,600 |
| 2017 | $4,733 | $168,300 | $60,700 | $107,600 |
| 2016 | $4,632 | $168,300 | $60,700 | $107,600 |
| 2015 | $4,485 | $168,300 | $60,700 | $107,600 |
| 2014 | $4,327 | $168,300 | $60,700 | $107,600 |
Source: Public Records
Map
Nearby Homes
- 19 Sunset Blvd
- 59 Estates Dr
- 331 Birmingham Rd
- 335 Birmingham Rd
- 38 North Rd
- 176 S Pemberton Rd
- 2405 Route 206
- 68 Brandywine Rd
- 195 N Pemberton Rd
- 38 Hearthstone Blvd
- 26 Nicholas St
- 6 Mulberry Ln
- 1 Nelson's Way
- 0 Pemberton Vincentown Rd
- 120 Hanover St
- The Laurelton Plan at East Gate at Wexford
- The Marigold Plan at East Gate at Wexford
- The Ashton Plan at East Gate at Wexford
- The Oakton Plan at East Gate at Wexford
- 60 Hanover St