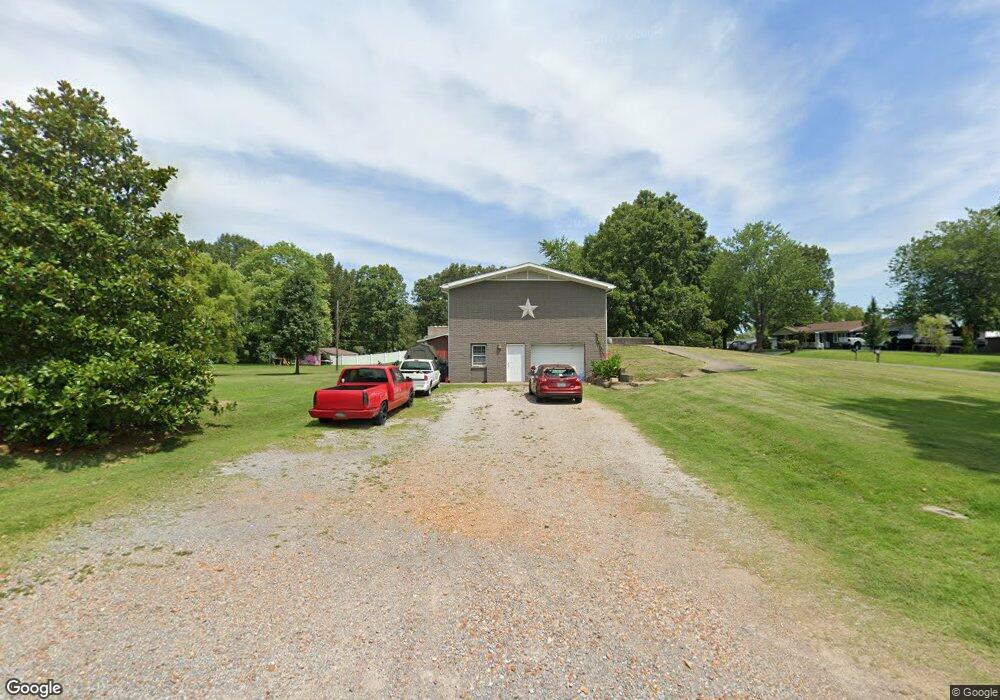
735 E 9th Ave Calvert City, KY 42029
Estimated Value: $144,000 - $153,000
4
Beds
2
Baths
2,081
Sq Ft
$72/Sq Ft
Est. Value
About This Home
This home is located at 735 E 9th Ave, Calvert City, KY 42029 and is currently estimated at $150,381, approximately $72 per square foot. 735 E 9th Ave is a home located in Marshall County with nearby schools including Calvert City Elementary School, North Marshall Middle School, and Marshall County High School.
Ownership History
Date
Name
Owned For
Owner Type
Purchase Details
Closed on
Nov 20, 2014
Sold by
Musgrove Kenneth W and Musgrove Paula K
Bought by
Peck Jeffrey L and Peck Sarah B
Current Estimated Value
Home Financials for this Owner
Home Financials are based on the most recent Mortgage that was taken out on this home.
Original Mortgage
$85,000
Outstanding Balance
$64,613
Interest Rate
3.95%
Mortgage Type
Stand Alone Refi Refinance Of Original Loan
Estimated Equity
$85,768
Create a Home Valuation Report for This Property
The Home Valuation Report is an in-depth analysis detailing your home's value as well as a comparison with similar homes in the area
Home Values in the Area
Average Home Value in this Area
Purchase History
| Date | Buyer | Sale Price | Title Company |
|---|---|---|---|
| Peck Jeffrey L | $85,000 | None Available |
Source: Public Records
Mortgage History
| Date | Status | Borrower | Loan Amount |
|---|---|---|---|
| Open | Peck Jeffrey L | $85,000 |
Source: Public Records
Tax History
| Year | Tax Paid | Tax Assessment Tax Assessment Total Assessment is a certain percentage of the fair market value that is determined by local assessors to be the total taxable value of land and additions on the property. | Land | Improvement |
|---|---|---|---|---|
| 2025 | $945 | $115,000 | $12,000 | $103,000 |
| 2024 | $958 | $115,000 | $12,000 | $103,000 |
| 2023 | $995 | $115,000 | $12,000 | $103,000 |
| 2022 | $1,036 | $115,000 | $12,000 | $103,000 |
| 2021 | $780 | $85,600 | $12,000 | $73,600 |
| 2020 | $786 | $85,600 | $12,000 | $73,600 |
| 2019 | $785 | $85,600 | $12,000 | $73,600 |
| 2018 | $787 | $85,600 | $12,000 | $73,600 |
| 2017 | $787 | $85,600 | $12,000 | $73,600 |
| 2016 | $788 | $85,600 | $12,000 | $73,600 |
| 2015 | $792 | $85,600 | $12,000 | $73,600 |
| 2014 | $790 | $85,600 | $0 | $0 |
| 2010 | -- | $85,600 | $12,000 | $73,600 |
Source: Public Records
Map
Nearby Homes
- 514 Pine Ave
- 00 Pine St
- 833 Cedar St
- 587 Elder St
- 808 Oak Park Blvd
- 1041 S Main St
- 658 E 5th Ave
- 581 S Main St
- 1532 Oak Park Blvd
- 43 2nd Ave SE
- 4300 U S 62
- 78 Ash St
- 1339 Colorado St
- 300 Scillion Dr
- 000 Lone Valley Rd
- Lot 24 Ford Square Dr
- Lot 8 Ford Square Dr
- Lot 15 Ford Square Dr
- Lot 19 Ford Square Dr
- Lot 21 Ford Square Dr
Your Personal Tour Guide
Ask me questions while you tour the home.