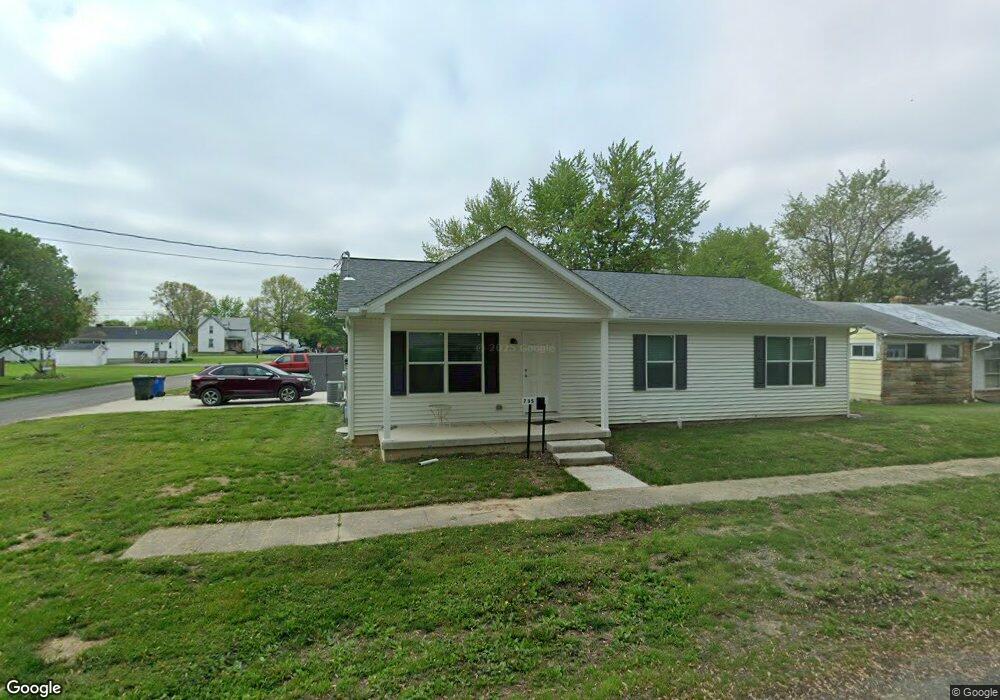
735 Euclid Ave Delphos, OH 45833
Estimated Value: $62,000 - $272,000
3
Beds
1
Bath
979
Sq Ft
$153/Sq Ft
Est. Value
About This Home
This home is located at 735 Euclid Ave, Delphos, OH 45833 and is currently estimated at $150,000, approximately $153 per square foot. 735 Euclid Ave is a home located in Allen County with nearby schools including Delphos St. John's High School and Delphos St. John's Elementary School.
Ownership History
Date
Name
Owned For
Owner Type
Purchase Details
Closed on
Nov 30, 2023
Sold by
Mcneal Katherine A
Bought by
Mcneal David E and Mcneal Sue A
Current Estimated Value
Purchase Details
Closed on
Nov 2, 2020
Sold by
Mcneal David E and Mcneal Sue A
Bought by
Mcneal Katherine A and The Mcneal Preservation Trust
Purchase Details
Closed on
Jul 30, 2002
Sold by
Garder Donald J
Bought by
Mcneal David E and Mcneal Sue A
Home Financials for this Owner
Home Financials are based on the most recent Mortgage that was taken out on this home.
Original Mortgage
$30,750
Interest Rate
6.8%
Mortgage Type
New Conventional
Purchase Details
Closed on
Jan 1, 1990
Bought by
Carder Donald J
Create a Home Valuation Report for This Property
The Home Valuation Report is an in-depth analysis detailing your home's value as well as a comparison with similar homes in the area
Home Values in the Area
Average Home Value in this Area
Purchase History
| Date | Buyer | Sale Price | Title Company |
|---|---|---|---|
| Mcneal David E | -- | None Listed On Document | |
| Mcneal Katherine A | -- | None Listed On Document | |
| Mcneal Katherine A | -- | None Available | |
| Mcneal David E | $30,000 | -- | |
| Carder Donald J | -- | -- |
Source: Public Records
Mortgage History
| Date | Status | Borrower | Loan Amount |
|---|---|---|---|
| Previous Owner | Mcneal David E | $30,750 |
Source: Public Records
Tax History Compared to Growth
Tax History
| Year | Tax Paid | Tax Assessment Tax Assessment Total Assessment is a certain percentage of the fair market value that is determined by local assessors to be the total taxable value of land and additions on the property. | Land | Improvement |
|---|---|---|---|---|
| 2024 | $280 | $8,300 | $7,180 | $1,120 |
| 2023 | $611 | $17,890 | $5,360 | $12,530 |
| 2022 | $626 | $17,890 | $5,360 | $12,530 |
| 2021 | $632 | $17,890 | $5,360 | $12,530 |
| 2020 | $511 | $15,370 | $5,110 | $10,260 |
| 2019 | $511 | $15,370 | $5,110 | $10,260 |
| 2018 | $525 | $15,370 | $5,110 | $10,260 |
| 2017 | $488 | $14,420 | $5,110 | $9,310 |
| 2016 | $502 | $14,420 | $5,110 | $9,310 |
| 2015 | $492 | $14,420 | $5,110 | $9,310 |
| 2014 | $425 | $12,500 | $4,900 | $7,600 |
| 2013 | $430 | $12,500 | $4,900 | $7,600 |
Source: Public Records
Map
Nearby Homes
- 508 S Washington St
- 1001 S Adams St
- 827 S Washington St
- 633 E 2nd St
- 424 S Canal St
- 221 S Main St
- 821 E 3rd St
- 903 E 3rd St
- 634 S Clay St
- 227 W Clime St Unit 10
- 914 E 3rd St
- 210 E 3rd St
- 606 S Cass St
- 405 N Franklin St
- 650 E 6th St
- 7110 Elida Rd
- 628 N Pierce St
- 610 N Washington St
- 704 N Franklin St
- 810 N Franklin St