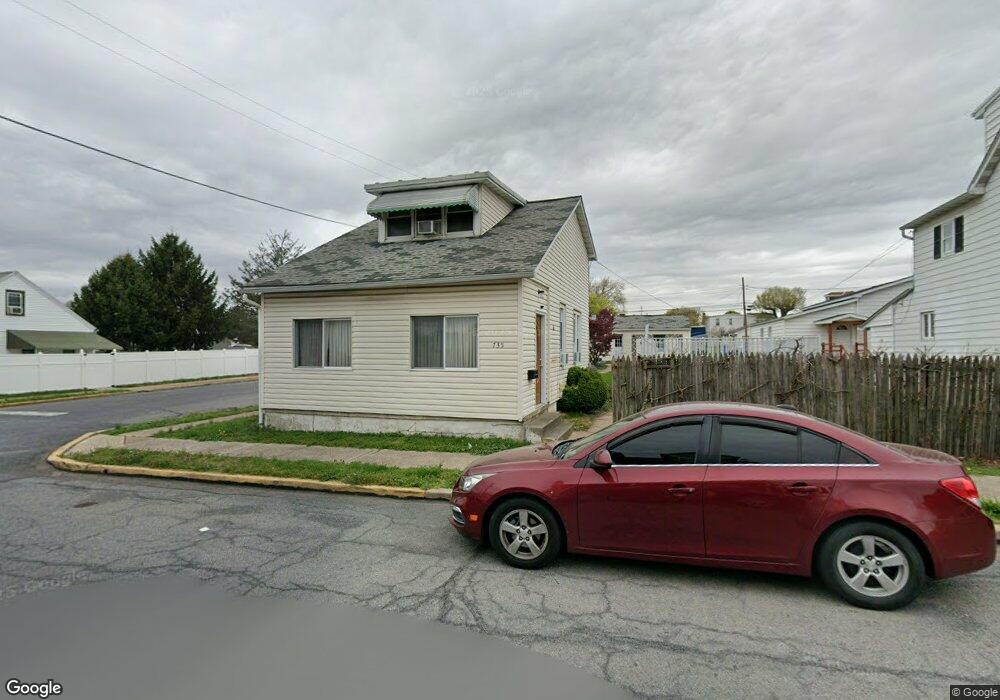
735 Euclid Ave Temple, PA 19560
Estimated Value: $137,000 - $242,000
2
Beds
1
Bath
786
Sq Ft
$257/Sq Ft
Est. Value
About This Home
This home is located at 735 Euclid Ave, Temple, PA 19560 and is currently estimated at $201,799, approximately $256 per square foot. 735 Euclid Ave is a home located in Berks County with nearby schools including Muhlenberg Elementary Center, C E Cole Intermediate School, and Muhlenberg Junior High School.
Ownership History
Date
Name
Owned For
Owner Type
Purchase Details
Closed on
Apr 3, 2008
Sold by
Moyer Karen
Bought by
Carbaugh Daniel J
Current Estimated Value
Purchase Details
Closed on
Apr 22, 2004
Sold by
Reifsnyder James and Reifsnyder Cindy
Bought by
Moyer Karen
Home Financials for this Owner
Home Financials are based on the most recent Mortgage that was taken out on this home.
Original Mortgage
$73,625
Interest Rate
5.4%
Mortgage Type
Purchase Money Mortgage
Purchase Details
Closed on
Jan 20, 2004
Sold by
Federal National Mortgage Association
Bought by
Reifsnyder James and Reifsnyder Cindy
Home Financials for this Owner
Home Financials are based on the most recent Mortgage that was taken out on this home.
Original Mortgage
$52,000
Interest Rate
5.8%
Mortgage Type
Purchase Money Mortgage
Purchase Details
Closed on
Oct 17, 2003
Sold by
Strunk Renee J
Bought by
Federal National Mortgage Association
Create a Home Valuation Report for This Property
The Home Valuation Report is an in-depth analysis detailing your home's value as well as a comparison with similar homes in the area
Home Values in the Area
Average Home Value in this Area
Purchase History
| Date | Buyer | Sale Price | Title Company |
|---|---|---|---|
| Carbaugh Daniel J | $212,562 | None Available | |
| Moyer Karen | $77,500 | Fidelity Natl Title Ins Co | |
| Reifsnyder James | $66,000 | First American Title Ins Co | |
| Federal National Mortgage Association | $1,300 | -- |
Source: Public Records
Mortgage History
| Date | Status | Borrower | Loan Amount |
|---|---|---|---|
| Previous Owner | Moyer Karen | $73,625 | |
| Previous Owner | Reifsnyder James | $52,000 |
Source: Public Records
Tax History
| Year | Tax Paid | Tax Assessment Tax Assessment Total Assessment is a certain percentage of the fair market value that is determined by local assessors to be the total taxable value of land and additions on the property. | Land | Improvement |
|---|---|---|---|---|
| 2025 | $1,132 | $75,400 | $32,900 | $42,500 |
| 2024 | $3,630 | $75,400 | $32,900 | $42,500 |
| 2023 | $3,407 | $75,400 | $32,900 | $42,500 |
| 2022 | $3,351 | $75,400 | $32,900 | $42,500 |
| 2021 | $3,271 | $75,400 | $32,900 | $42,500 |
| 2020 | $3,271 | $75,400 | $32,900 | $42,500 |
| 2019 | $3,202 | $75,400 | $32,900 | $42,500 |
| 2018 | $3,145 | $75,400 | $32,900 | $42,500 |
| 2017 | $3,086 | $75,400 | $32,900 | $42,500 |
| 2016 | $914 | $75,400 | $32,900 | $42,500 |
| 2015 | $914 | $75,400 | $32,900 | $42,500 |
| 2014 | $914 | $75,400 | $32,900 | $42,500 |
Source: Public Records
Map
Nearby Homes
- 740 Columbia Ave
- 5313 Allentown Pike
- 503 El Hatco Dr
- 706 Wagon Wheel Ln
- 1220 Hay Rd
- 5 Edgewood Ave
- 4212 5th Ave
- 34 Rosalie's Way
- 36 Rosalie's Way
- 38 Rosalie's Way
- 40 Rosalie's Way
- 46 Rosalie's Way
- 125 Tuckerton Rd Unit 916
- 125 Tuckerton Rd Unit 104
- 4012 Kutztown Rd
- 4000 6th Ave
- 1410 Margaret St
- 1709 Florence St
- 3611 Kutztown Rd
- 402 Mountainside Rd
- 741 Euclid Ave
- 747 Euclid Ave
- 743 Euclid Ave
- 733 Euclid Ave
- 746 Euclid Ave
- 742 Euclid Ave
- 729 Euclid Ave
- 750 Euclid Ave
- 736 Euclid Ave
- 738 Mount Laurel Ave
- 753 Euclid Ave
- 742 Mount Laurel Ave
- 734 Euclid Ave
- 725 Euclid Ave
- 734 Mount Laurel Ave
- 757 Euclid Ave
- 730 Euclid Ave
- 750 Mount Laurel Ave
- 728 Mount Laurel Ave
- 723 Euclid Ave
Your Personal Tour Guide
Ask me questions while you tour the home.