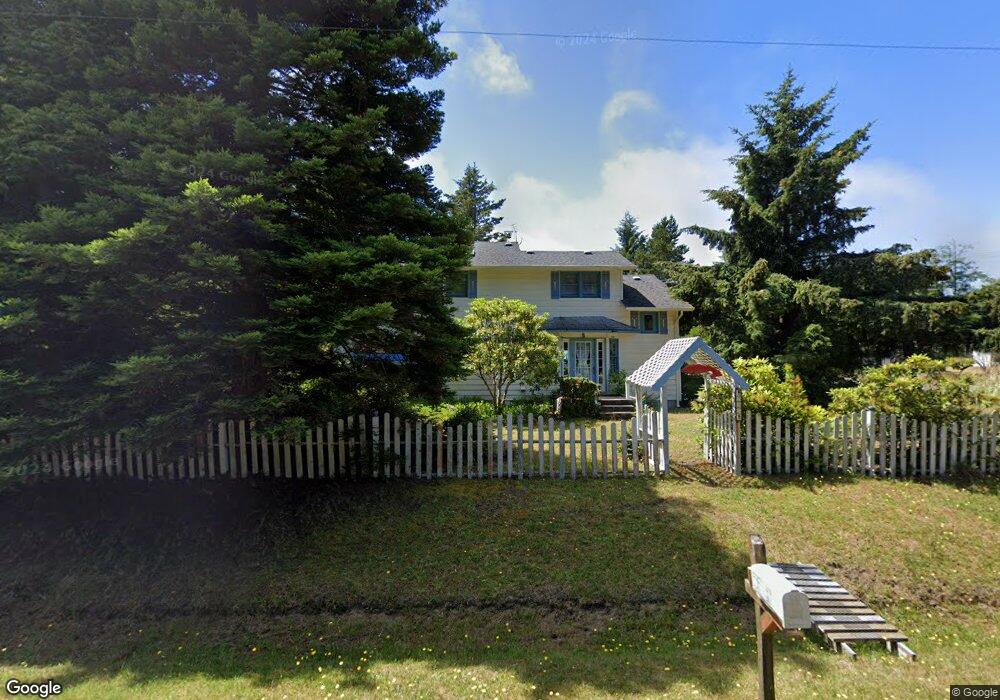
735 Falls of Clyde Loop SE Ocean Shores, WA 98569
Estimated Value: $313,871 - $421,000
3
Beds
2
Baths
1,456
Sq Ft
$264/Sq Ft
Est. Value
About This Home
This home is located at 735 Falls of Clyde Loop SE, Ocean Shores, WA 98569 and is currently estimated at $384,968, approximately $264 per square foot. 735 Falls of Clyde Loop SE is a home located in Grays Harbor County with nearby schools including North Beach Junior/Senior High School.
Ownership History
Date
Name
Owned For
Owner Type
Purchase Details
Closed on
Feb 12, 2024
Sold by
Golley Linda
Bought by
Mcdougall David Dewer
Current Estimated Value
Purchase Details
Closed on
May 9, 2014
Sold by
Mcdougall Dave and Mcdougall David
Bought by
Mcdougall David and Golley Linda
Home Financials for this Owner
Home Financials are based on the most recent Mortgage that was taken out on this home.
Original Mortgage
$113,600
Interest Rate
4.38%
Mortgage Type
New Conventional
Purchase Details
Closed on
Jan 30, 2012
Sold by
Mcdougall Pamela M
Bought by
Mcdougall David D
Purchase Details
Closed on
Jun 27, 2007
Sold by
Sanquist Carl E and Sanquist Claudia K
Bought by
Mcdougall Dave and Mcdougall Pamela M
Home Financials for this Owner
Home Financials are based on the most recent Mortgage that was taken out on this home.
Original Mortgage
$125,000
Interest Rate
6.41%
Mortgage Type
New Conventional
Create a Home Valuation Report for This Property
The Home Valuation Report is an in-depth analysis detailing your home's value as well as a comparison with similar homes in the area
Home Values in the Area
Average Home Value in this Area
Purchase History
| Date | Buyer | Sale Price | Title Company |
|---|---|---|---|
| Mcdougall David Dewer | -- | None Listed On Document | |
| Mcdougall David | -- | First American Title | |
| Mcdougall David D | $9,500 | None Available | |
| Mcdougall Dave | $185,000 | Grays Harbor Title |
Source: Public Records
Mortgage History
| Date | Status | Borrower | Loan Amount |
|---|---|---|---|
| Previous Owner | Mcdougall David | $113,600 | |
| Previous Owner | Mcdougall Dave | $125,000 |
Source: Public Records
Tax History Compared to Growth
Tax History
| Year | Tax Paid | Tax Assessment Tax Assessment Total Assessment is a certain percentage of the fair market value that is determined by local assessors to be the total taxable value of land and additions on the property. | Land | Improvement |
|---|---|---|---|---|
| 2025 | $1,637 | $258,500 | $45,000 | $213,500 |
| 2024 | $1,651 | $262,684 | $45,000 | $217,684 |
| 2023 | $1,730 | $264,562 | $75,000 | $189,562 |
| 2022 | $1,802 | $213,159 | $54,200 | $158,959 |
| 2021 | $1,794 | $213,159 | $54,200 | $158,959 |
| 2020 | $1,679 | $173,700 | $37,375 | $136,325 |
| 2019 | $1,497 | $156,432 | $32,500 | $123,932 |
| 2018 | $1,455 | $135,916 | $25,000 | $110,916 |
| 2017 | $1,464 | $124,824 | $25,000 | $99,824 |
| 2016 | $1,321 | $122,910 | $22,000 | $100,910 |
| 2014 | -- | $115,420 | $12,000 | $103,420 |
| 2013 | -- | $133,980 | $15,000 | $118,980 |
Source: Public Records
Map
Nearby Homes
- 764 Tern Ct SE
- 741 Wood Duck Ave SE
- 733 Wood Duck Ave SE
- 729 Wood Duck Ave SE
- 281 Cakesosta St SE
- 732 Albion Ave SE
- 893 Albion Ave SE
- 801 Mount Olympus Ave SE
- 772 Island Cir SE
- 854 Mount Olympus Ave SE
- 753 Island Cir SE
- 789 Island Cir SE
- 903 Mount Olympus Ave SE
- 991 Mount Olympus Ave SE
- 793 Island Cir SE
- 804 Meteor Ct SE
- 635 Island Cir SE
- 681 Lake Island Ave SE
- 697 Island Cir SE
- 735 Dover Ct SE
- 739 Falls of Clyde Loop SE
- 743 Falls of Clyde Loop SE
- 735 Mount Olympus Ave SE
- 741 Mount Olympus Ave SE
- 741 My Olympus Ave SE
- 752 Mount Olympus Ave SE
- 725 Mount Olympus Ave SE
- 746 Mount Olympus Ave SE
- 746 Wood Duck Ave SE
- 747 Falls of Clyde Loop SE
- 734 Falls of Clyde Loop SE
- 721 Mount Olympus Ave SE
- 730 Woodduck Ct SE
- 730 Wood Duck Ave SE
- 736 Falls of Clyde Loop SE
- 724 Woodduck Ct SE
- 742 Falls of Clyde Loop SE
- 711 Baldpate Ct SE
- 740 Falls of Clyde Loop SE