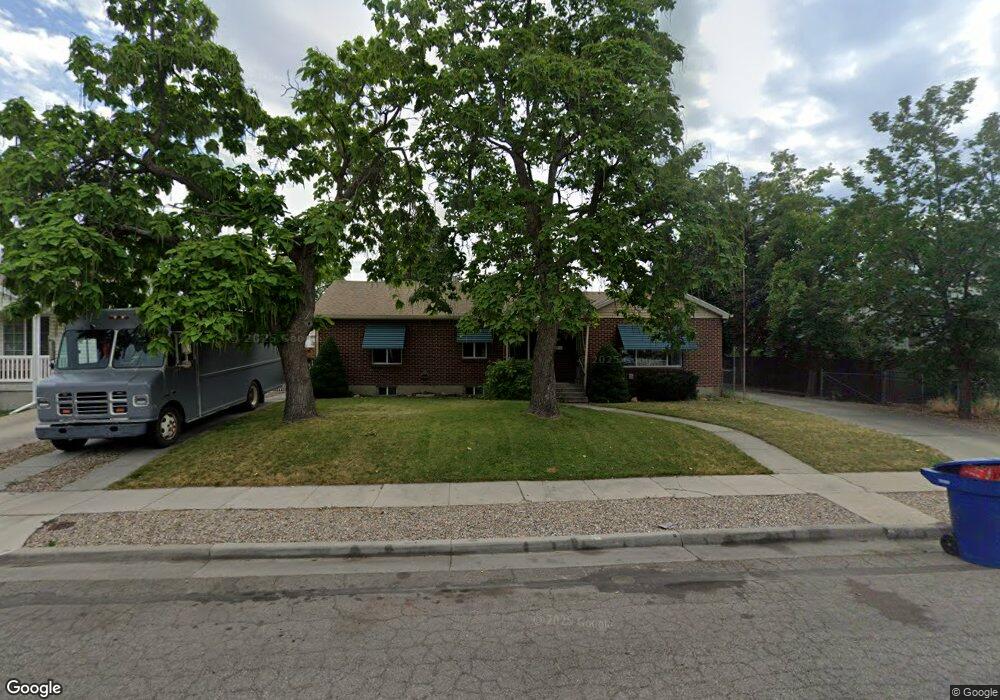
735 Goshen St Salt Lake City, UT 84104
Poplar Grove NeighborhoodEstimated Value: $415,000 - $472,301
3
Beds
2
Baths
1,071
Sq Ft
$420/Sq Ft
Est. Value
About This Home
This home is located at 735 Goshen St, Salt Lake City, UT 84104 and is currently estimated at $449,825, approximately $420 per square foot. 735 Goshen St is a home located in Salt Lake County with nearby schools including Riley Elementary School, Glendale Middle, and Highland High School.
Ownership History
Date
Name
Owned For
Owner Type
Purchase Details
Closed on
Dec 7, 2018
Sold by
Ruebush Jason and Ruebush Gwen
Bought by
Ruebush Jason Wade and Ruebush Gwen Kathryn
Current Estimated Value
Home Financials for this Owner
Home Financials are based on the most recent Mortgage that was taken out on this home.
Original Mortgage
$160,000
Outstanding Balance
$139,530
Interest Rate
4.5%
Mortgage Type
Unknown
Estimated Equity
$310,295
Purchase Details
Closed on
Oct 16, 2018
Sold by
Leary Leary Brian L Brian L
Bought by
Ruebush Jason and Ruebush Gwen
Home Financials for this Owner
Home Financials are based on the most recent Mortgage that was taken out on this home.
Original Mortgage
$160,000
Outstanding Balance
$139,530
Interest Rate
4.5%
Mortgage Type
Unknown
Estimated Equity
$310,295
Purchase Details
Closed on
Sep 4, 2003
Sold by
Leary Lester and Leary Louise
Bought by
Leary Lester and Leary Louise
Create a Home Valuation Report for This Property
The Home Valuation Report is an in-depth analysis detailing your home's value as well as a comparison with similar homes in the area
Home Values in the Area
Average Home Value in this Area
Purchase History
| Date | Buyer | Sale Price | Title Company |
|---|---|---|---|
| Ruebush Jason Wade | -- | None Available | |
| Ruebush Jason | -- | Meridian Title | |
| Leary Lester | -- | -- |
Source: Public Records
Mortgage History
| Date | Status | Borrower | Loan Amount |
|---|---|---|---|
| Open | Ruebush Jason | $160,000 |
Source: Public Records
Tax History Compared to Growth
Tax History
| Year | Tax Paid | Tax Assessment Tax Assessment Total Assessment is a certain percentage of the fair market value that is determined by local assessors to be the total taxable value of land and additions on the property. | Land | Improvement |
|---|---|---|---|---|
| 2025 | $2,036 | $428,800 | $144,900 | $283,900 |
| 2024 | $2,036 | $388,500 | $137,100 | $251,400 |
| 2023 | $1,932 | $355,300 | $131,800 | $223,500 |
| 2022 | $2,065 | $356,300 | $129,300 | $227,000 |
| 2021 | $1,735 | $271,000 | $97,900 | $173,100 |
| 2020 | $1,661 | $247,000 | $87,400 | $159,600 |
| 2019 | $1,697 | $237,400 | $87,400 | $150,000 |
| 2018 | $0 | $193,600 | $79,000 | $114,600 |
| 2017 | $547 | $193,000 | $79,000 | $114,000 |
| 2016 | $542 | $181,500 | $66,500 | $115,000 |
| 2015 | $1,502 | $172,600 | $67,300 | $105,300 |
| 2014 | -- | $160,300 | $64,300 | $96,000 |
Source: Public Records
Map
Nearby Homes