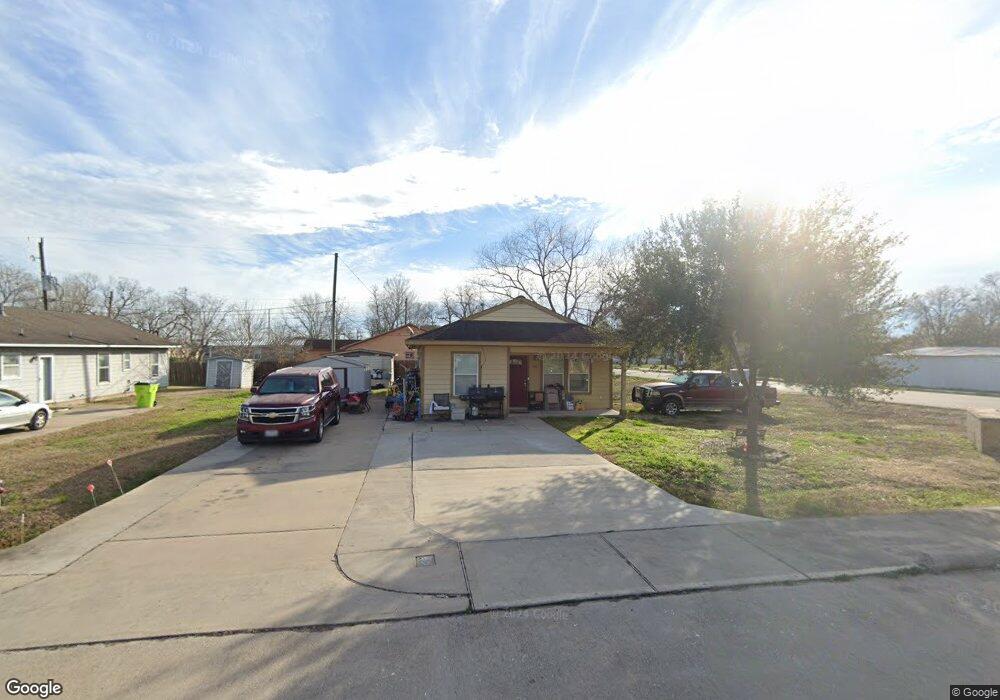
735 Habitat Rosenberg, TX 77471
Estimated Value: $190,000 - $263,000
3
Beds
2
Baths
1,325
Sq Ft
$168/Sq Ft
Est. Value
About This Home
This home is located at 735 Habitat, Rosenberg, TX 77471 and is currently estimated at $222,643, approximately $168 per square foot. 735 Habitat is a home located in Fort Bend County with nearby schools including Travis Elementary School, Henry Wertheimer Middle School, and Briscoe Junior High School.
Ownership History
Date
Name
Owned For
Owner Type
Purchase Details
Closed on
Aug 13, 2009
Sold by
Fort Bend Habitat For Humanity
Bought by
Martinez Osbaldo and Martinez Rosie
Current Estimated Value
Home Financials for this Owner
Home Financials are based on the most recent Mortgage that was taken out on this home.
Original Mortgage
$55,000
Outstanding Balance
$36,043
Interest Rate
5.31%
Mortgage Type
Seller Take Back
Estimated Equity
$186,600
Create a Home Valuation Report for This Property
The Home Valuation Report is an in-depth analysis detailing your home's value as well as a comparison with similar homes in the area
Home Values in the Area
Average Home Value in this Area
Purchase History
| Date | Buyer | Sale Price | Title Company |
|---|---|---|---|
| Martinez Osbaldo | -- | Fort Bend Title Llc |
Source: Public Records
Mortgage History
| Date | Status | Borrower | Loan Amount |
|---|---|---|---|
| Open | Martinez Osbaldo | $55,000 |
Source: Public Records
Tax History Compared to Growth
Tax History
| Year | Tax Paid | Tax Assessment Tax Assessment Total Assessment is a certain percentage of the fair market value that is determined by local assessors to be the total taxable value of land and additions on the property. | Land | Improvement |
|---|---|---|---|---|
| 2025 | $1,881 | $191,385 | $30,774 | $164,880 |
| 2024 | $1,881 | $173,986 | $6,724 | $167,262 |
| 2023 | $1,657 | $158,169 | $0 | $169,688 |
| 2022 | $2,216 | $143,790 | $5,430 | $138,360 |
| 2021 | $2,712 | $130,720 | $18,460 | $112,260 |
| 2020 | $2,746 | $129,390 | $18,460 | $110,930 |
| 2019 | $3,011 | $131,810 | $18,460 | $113,350 |
| 2018 | $2,899 | $124,900 | $18,460 | $106,440 |
| 2017 | $2,908 | $124,570 | $18,460 | $106,110 |
| 2016 | $2,911 | $124,710 | $18,460 | $106,250 |
| 2015 | $2,537 | $129,310 | $18,460 | $110,850 |
| 2014 | $2,691 | $128,460 | $18,460 | $110,000 |
Source: Public Records
Map
Nearby Homes