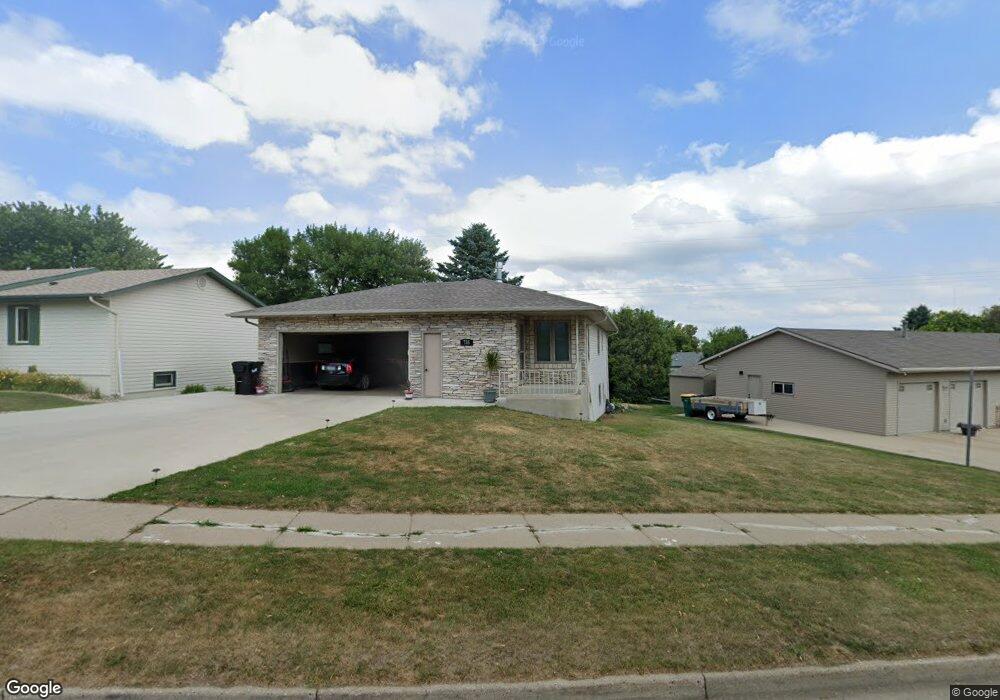
735 N 33rd St Bismarck, ND 58501
Southeast Bismarck NeighborhoodEstimated Value: $309,000 - $354,000
3
Beds
2
Baths
2,022
Sq Ft
$163/Sq Ft
Est. Value
About This Home
This home is located at 735 N 33rd St, Bismarck, ND 58501 and is currently estimated at $330,118, approximately $163 per square foot. 735 N 33rd St is a home located in Burleigh County with nearby schools including Rita Murphy Elementary School, Simle Middle School, and Legacy High School.
Ownership History
Date
Name
Owned For
Owner Type
Purchase Details
Closed on
May 14, 2021
Sold by
Brendel Randy
Bought by
Brendel Colton
Current Estimated Value
Home Financials for this Owner
Home Financials are based on the most recent Mortgage that was taken out on this home.
Original Mortgage
$229,191
Outstanding Balance
$205,482
Interest Rate
3.1%
Mortgage Type
FHA
Estimated Equity
$124,636
Purchase Details
Closed on
Sep 25, 2020
Sold by
Ford Roberta
Bought by
Brendel Randy
Purchase Details
Closed on
Feb 23, 2011
Sold by
Brann Lynn M and Brann Christopher W
Bought by
Auchele Larry
Purchase Details
Closed on
Aug 20, 2010
Sold by
Ringdahl Perry A and Ringdahl Susan J
Bought by
Ford Robert
Home Financials for this Owner
Home Financials are based on the most recent Mortgage that was taken out on this home.
Original Mortgage
$162,960
Interest Rate
4%
Mortgage Type
FHA
Create a Home Valuation Report for This Property
The Home Valuation Report is an in-depth analysis detailing your home's value as well as a comparison with similar homes in the area
Home Values in the Area
Average Home Value in this Area
Purchase History
| Date | Buyer | Sale Price | Title Company |
|---|---|---|---|
| Brendel Colton | $269,000 | Bismarck Title Company | |
| Brendel Randy | $279,000 | Bismarck Title Company | |
| Auchele Larry | $173,000 | Bismarck Title Co | |
| Ford Robert | $187,500 | -- |
Source: Public Records
Mortgage History
| Date | Status | Borrower | Loan Amount |
|---|---|---|---|
| Open | Brendel Colton | $229,191 | |
| Previous Owner | Ford Robert | $162,960 |
Source: Public Records
Tax History
| Year | Tax Paid | Tax Assessment Tax Assessment Total Assessment is a certain percentage of the fair market value that is determined by local assessors to be the total taxable value of land and additions on the property. | Land | Improvement |
|---|---|---|---|---|
| 2025 | $1,767 | $157,800 | $31,000 | $126,800 |
| 2024 | $2,863 | $137,650 | $28,000 | $109,650 |
| 2023 | $3,220 | $137,650 | $28,000 | $109,650 |
| 2022 | $2,724 | $125,350 | $28,000 | $97,350 |
| 2021 | $2,864 | $125,200 | $26,000 | $99,200 |
| 2020 | $2,784 | $126,300 | $26,000 | $100,300 |
| 2019 | $2,623 | $123,200 | $0 | $0 |
| 2018 | $2,398 | $123,200 | $26,000 | $97,200 |
| 2017 | $2,331 | $123,200 | $26,000 | $97,200 |
| 2016 | $2,331 | $123,200 | $21,000 | $102,200 |
| 2014 | -- | $111,200 | $0 | $0 |
Source: Public Records
Map
Nearby Homes
- 914 N 35th St
- 621 N 35th St
- 1115/1117 Socorro Place
- 3218/3220 Eastside Place
- 512 Gary Ave
- 1046 N 29th St
- 1304 Sorrento Cir
- 1401 Sharloh Loop Unit 9
- 1926 N 26th St
- 1313 N 26th St
- 1920 N 26th St
- 1501 N 35th St Unit 1
- 2412 E Avenue C
- 3330 Baltus Ln Unit 2
- 3101 Sleepy Hollow Loop
- 2509 E Boulevard Ave
- 507 N 22nd St
- 700 N 22nd St
- 1548 Morning View
- 410 N 22nd St
Your Personal Tour Guide
Ask me questions while you tour the home.