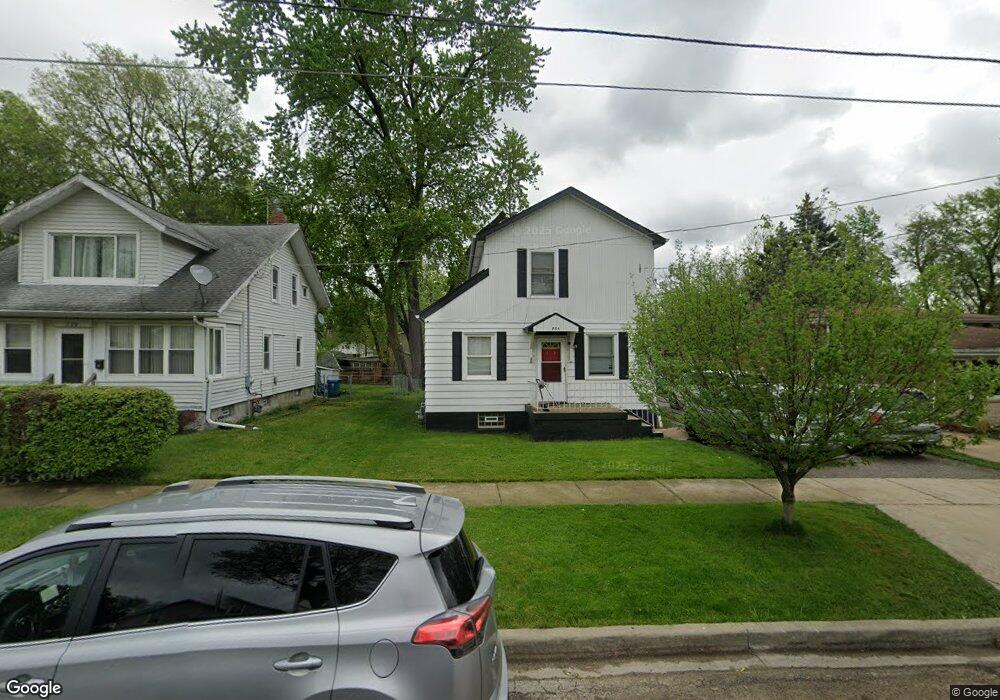
735 N View St Aurora, IL 60506
North River NeighborhoodEstimated Value: $239,000 - $281,000
2
Beds
2
Baths
1,428
Sq Ft
$181/Sq Ft
Est. Value
About This Home
This home is located at 735 N View St, Aurora, IL 60506 and is currently estimated at $258,557, approximately $181 per square foot. 735 N View St is a home located in Kane County with nearby schools including Hill Elementary School, Herget Middle School, and West Aurora High School.
Ownership History
Date
Name
Owned For
Owner Type
Purchase Details
Closed on
Nov 29, 1999
Sold by
Frieman Russell R
Bought by
Freiman Russell R and Freiman Robin A
Current Estimated Value
Home Financials for this Owner
Home Financials are based on the most recent Mortgage that was taken out on this home.
Original Mortgage
$66,000
Outstanding Balance
$20,583
Interest Rate
7.81%
Estimated Equity
$237,974
Purchase Details
Closed on
Mar 9, 1999
Sold by
The Bank Of New York
Bought by
Freiman Russell
Purchase Details
Closed on
Sep 11, 1998
Sold by
Burgess Robert A and Burgess Ernestine
Bought by
The Bank Of New York
Purchase Details
Closed on
Apr 27, 1995
Sold by
Greatbanc Trust Company
Bought by
Burgess Robert A and Burgess Ernestine
Home Financials for this Owner
Home Financials are based on the most recent Mortgage that was taken out on this home.
Original Mortgage
$20,000
Interest Rate
8.42%
Create a Home Valuation Report for This Property
The Home Valuation Report is an in-depth analysis detailing your home's value as well as a comparison with similar homes in the area
Home Values in the Area
Average Home Value in this Area
Purchase History
| Date | Buyer | Sale Price | Title Company |
|---|---|---|---|
| Freiman Russell R | -- | Law Title | |
| Freiman Russell | $35,000 | -- | |
| The Bank Of New York | -- | Wheatland Title | |
| Burgess Robert A | -- | Wheatland Title |
Source: Public Records
Mortgage History
| Date | Status | Borrower | Loan Amount |
|---|---|---|---|
| Open | Freiman Russell R | $66,000 | |
| Previous Owner | Burgess Robert A | $20,000 |
Source: Public Records
Tax History
| Year | Tax Paid | Tax Assessment Tax Assessment Total Assessment is a certain percentage of the fair market value that is determined by local assessors to be the total taxable value of land and additions on the property. | Land | Improvement |
|---|---|---|---|---|
| 2024 | $4,870 | $61,508 | $7,955 | $53,553 |
| 2023 | $4,707 | $54,957 | $7,108 | $47,849 |
| 2022 | $4,439 | $50,143 | $6,485 | $43,658 |
| 2021 | $4,148 | $45,396 | $6,038 | $39,358 |
| 2020 | $3,947 | $42,166 | $5,608 | $36,558 |
| 2019 | $3,910 | $39,984 | $5,196 | $34,788 |
| 2018 | $3,691 | $36,972 | $4,806 | $32,166 |
| 2017 | $3,404 | $33,076 | $4,428 | $28,648 |
| 2016 | $3,123 | $29,400 | $3,796 | $25,604 |
| 2015 | -- | $28,603 | $3,264 | $25,339 |
| 2014 | -- | $26,536 | $3,140 | $23,396 |
| 2013 | -- | $26,157 | $3,095 | $23,062 |
Source: Public Records
Map
Nearby Homes
- 418 W Illinois Ave
- 355 Lawndale Ave
- 603 N May St
- 519 N View St
- 509 N Park Ave
- 415 Blackhawk St
- 507 W Park Ave
- 1060 N Highland Ave
- 1062 N Highland Ave
- 837 Taylor Ave
- 338 Lakelawn Blvd
- 14-18 N Lake St
- 847 Foran Ln
- 424 N Lancaster Ave
- 514 Spruce St
- 109 N May St
- 231-233 Williams St
- 932 W New York St
- 833 Sheldon Ave
- 479 N Lake St
Your Personal Tour Guide
Ask me questions while you tour the home.