Estimated Value: $620,000 - $634,000
3
Beds
3
Baths
1,763
Sq Ft
$356/Sq Ft
Est. Value
About This Home
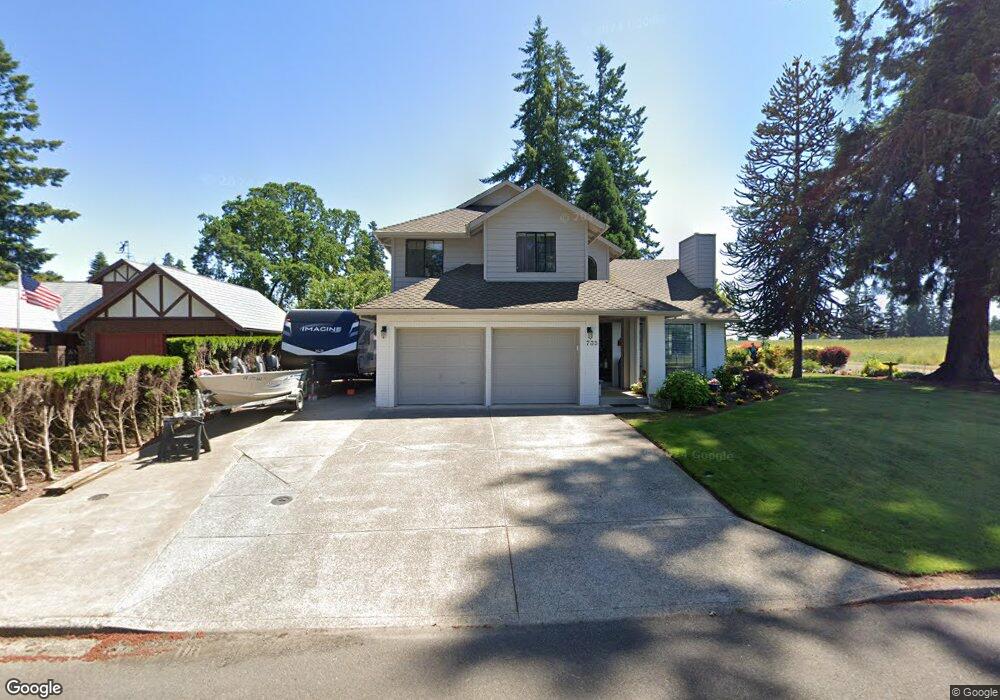
This home is located at 735 NE 30th Place, Canby, OR 97013 and is currently estimated at $627,883, approximately $356 per square foot. 735 NE 30th Place is a home located in Clackamas County with nearby schools including Howard Eccles Elementary School, Baker Prairie Middle School, and Canby High School.
Ownership History
Date
Name
Owned For
Owner Type
Purchase Details
Closed on
Feb 5, 2020
Sold by
Brown Lynne and Brown Michael
Bought by
Brown Lynne and Brown Michael
Current Estimated Value
Purchase Details
Closed on
Jul 27, 2015
Sold by
Mueller Roger K and Mueller Carolyn S
Bought by
Brown Lynne and Brown Michael
Home Financials for this Owner
Home Financials are based on the most recent Mortgage that was taken out on this home.
Original Mortgage
$302,100
Outstanding Balance
$235,889
Interest Rate
3.98%
Mortgage Type
New Conventional
Estimated Equity
$391,994
Purchase Details
Closed on
Dec 21, 2007
Sold by
Gorbett Paul and Gorbett Stacy
Bought by
Mueller Roger K and Mueller Carolyn S
Home Financials for this Owner
Home Financials are based on the most recent Mortgage that was taken out on this home.
Original Mortgage
$308,560
Interest Rate
6.15%
Mortgage Type
FHA
Purchase Details
Closed on
May 8, 2007
Sold by
Harmon Patrick S and Harmon Laurie J
Bought by
Gorbett Paul and Gorbett Stacy
Purchase Details
Closed on
Feb 27, 1998
Sold by
Rose Valerie and Rose Steve
Bought by
Harmon Patrick S and Harmon Laurie J
Create a Home Valuation Report for This Property
The Home Valuation Report is an in-depth analysis detailing your home's value as well as a comparison with similar homes in the area
Home Values in the Area
Average Home Value in this Area
Purchase History
| Date | Buyer | Sale Price | Title Company |
|---|---|---|---|
| Brown Lynne | -- | None Available | |
| Brown Lynne | $318,000 | First American | |
| Mueller Roger K | $357,000 | First American Title Insuran | |
| Gorbett Paul | $355,000 | First American Title Insuran | |
| Harmon Patrick S | $120,000 | Chicago Title |
Source: Public Records
Mortgage History
| Date | Status | Borrower | Loan Amount |
|---|---|---|---|
| Open | Brown Lynne | $302,100 | |
| Previous Owner | Mueller Roger K | $308,560 |
Source: Public Records
Tax History Compared to Growth
Tax History
| Year | Tax Paid | Tax Assessment Tax Assessment Total Assessment is a certain percentage of the fair market value that is determined by local assessors to be the total taxable value of land and additions on the property. | Land | Improvement |
|---|---|---|---|---|
| 2025 | $6,400 | $361,252 | -- | -- |
| 2024 | $6,221 | $350,731 | -- | -- |
| 2023 | $6,221 | $340,516 | $0 | $0 |
| 2022 | $5,722 | $330,599 | $0 | $0 |
| 2021 | $5,510 | $320,970 | $0 | $0 |
| 2020 | $5,411 | $311,622 | $0 | $0 |
| 2019 | $5,153 | $302,546 | $0 | $0 |
| 2018 | $5,038 | $293,734 | $0 | $0 |
| 2017 | $4,910 | $285,179 | $0 | $0 |
| 2016 | $4,747 | $276,873 | $0 | $0 |
| 2015 | $4,584 | $268,809 | $0 | $0 |
| 2014 | $4,452 | $260,980 | $0 | $0 |
Source: Public Records
Map
Nearby Homes
- 2152 N Laurelwood St
- 1200 NE Territorial Rd Unit 93
- 1762 N Oak St
- 832 NE 17th Ave
- 838 NE 17th Ave
- 844 NE 17th Ave
- 878 NE 17th Ave
- 952 NE 17th Ave
- 1751 N Laurelwood Loop
- 853 NE 17th Ave
- 947 NE 17th Ave
- 1422 NE 18th Place
- 1258 NE 17th Ave
- 1009 NE 17th Ave
- 1552 NE 19th Loop
- 32088 SW Peach Cove Rd
- 1947 NE 21st Ave
- 1721 N Hyssop St
- 860 NE 14th Ave
- 312 NE 14th Ave
- 785 NE 30th Place
- 740 NE 29th Place
- 730 NE 30th Place
- 780 NE 30th Place
- 775 NE 31st Place
- 795 NE 29th Place
- 3040 N Maple St
- 2880 N Maple Ct
- 2870 N Maple Ct
- 2860 N Maple Ct
- 720 NE 31st Place
- 2875 N Maple Ct
- 770 NE 31st Place
- 2830 N Maple Ct
- 2825 N Maple Ct
- 3100 N Maple St
- 2790 N Maple St
- 2785 N Maple Ct
- 2810 N Maple Ct
- 3140 N Maple St