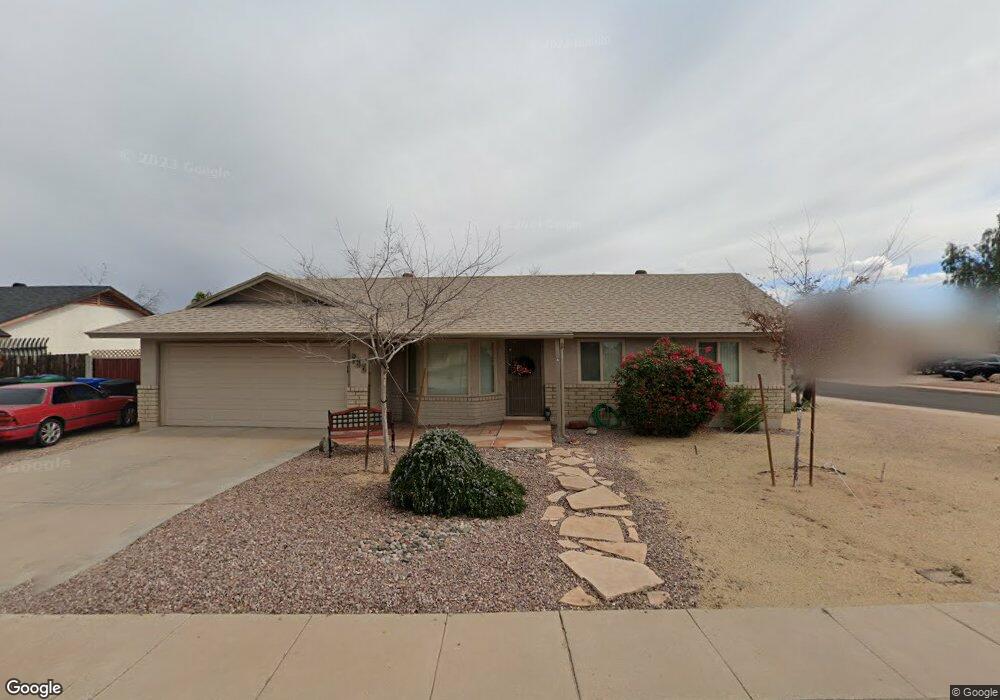
735 S 37th St Mesa, AZ 85206
Central Mesa NeighborhoodEstimated Value: $373,166 - $470,000
Studio
2
Baths
1,285
Sq Ft
$334/Sq Ft
Est. Value
About This Home
This home is located at 735 S 37th St, Mesa, AZ 85206 and is currently estimated at $429,292, approximately $334 per square foot. 735 S 37th St is a home located in Maricopa County with nearby schools including Johnson Elementary School, Franklin at Brimhall Elementary School, and Franklin West Elementary School.
Ownership History
Date
Name
Owned For
Owner Type
Purchase Details
Closed on
Jun 15, 2001
Sold by
Webb Jennifer
Bought by
Frisby Jonathan M
Current Estimated Value
Home Financials for this Owner
Home Financials are based on the most recent Mortgage that was taken out on this home.
Original Mortgage
$109,000
Outstanding Balance
$41,551
Interest Rate
7.15%
Estimated Equity
$387,741
Purchase Details
Closed on
Mar 25, 1999
Sold by
Feisby Jonathan
Bought by
Webb Jennifer
Purchase Details
Closed on
May 3, 1995
Sold by
Kelly John
Bought by
Frisby Jonathan Matthew and Frisby Jonathan M
Home Financials for this Owner
Home Financials are based on the most recent Mortgage that was taken out on this home.
Original Mortgage
$86,050
Interest Rate
7.92%
Mortgage Type
New Conventional
Create a Home Valuation Report for This Property
The Home Valuation Report is an in-depth analysis detailing your home's value as well as a comparison with similar homes in the area
Home Values in the Area
Average Home Value in this Area
Purchase History
| Date | Buyer | Sale Price | Title Company |
|---|---|---|---|
| Frisby Jonathan M | -- | Chicago Title Insurance Co | |
| Webb Jennifer | -- | -- | |
| Frisby Jonathan Matthew | $90,600 | Stewart Title & Trust |
Source: Public Records
Mortgage History
| Date | Status | Borrower | Loan Amount |
|---|---|---|---|
| Open | Frisby Jonathan M | $109,000 | |
| Previous Owner | Frisby Jonathan Matthew | $86,050 |
Source: Public Records
Tax History
| Year | Tax Paid | Tax Assessment Tax Assessment Total Assessment is a certain percentage of the fair market value that is determined by local assessors to be the total taxable value of land and additions on the property. | Land | Improvement |
|---|---|---|---|---|
| 2025 | $1,277 | $15,371 | -- | -- |
| 2024 | $1,290 | $14,639 | -- | -- |
| 2023 | $1,290 | $29,360 | $5,870 | $23,490 |
| 2022 | $1,262 | $23,350 | $4,670 | $18,680 |
| 2021 | $1,297 | $21,910 | $4,380 | $17,530 |
| 2020 | $1,279 | $20,150 | $4,030 | $16,120 |
| 2019 | $1,185 | $18,080 | $3,610 | $14,470 |
| 2018 | $1,132 | $16,470 | $3,290 | $13,180 |
| 2017 | $1,096 | $14,860 | $2,970 | $11,890 |
| 2016 | $1,076 | $14,320 | $2,860 | $11,460 |
| 2015 | $1,016 | $13,220 | $2,640 | $10,580 |
Source: Public Records
Map
Nearby Homes
- 3544 E Diamond Ave
- 921 S Val Vista Dr Unit 135
- 921 S Val Vista Dr Unit 83
- 921 S Val Vista Dr Unit 11
- 712 S 34th St
- 1015 S Val Vista Dr Unit 22
- 1015 S Val Vista Dr Unit 72
- 3755 E Broadway Rd Unit 96
- 1038 S 38th St
- 441 S Maple Unit 95
- 441 S Maple Unit 62
- 441 S Maple Unit 8
- 3325 E Carmel Ave
- 3440 E Southern Ave Unit 1094
- 4022 E Carol Cir
- 4036 E Clovis Cir
- 305 S Val Vista Dr Unit 78
- 305 S Val Vista Dr Unit 193
- 305 S Val Vista Dr Unit 436
- 305 S Val Vista Dr Unit 280
- 727 S 37th St
- 3710 E Dulciana Ave
- 3703 E Diamond Ave
- 3716 E Dulciana Ave
- 719 S 37th St
- 3709 E Diamond Ave
- 728 S 37th St
- 3722 E Dulciana Ave
- 720 S 37th St
- 3715 E Diamond Ave
- 711 S 37th St
- 3708 E Pueblo Ave
- 3712 E Pueblo Ave
- 3724 E Diamond Ave
- 712 S 37th St
- 723 S Bermuda Cir
- 3721 E Diamond Ave
- 3728 E Dulciana Ave
- 3735 E Dulciana Ave
- 3716 E Pueblo Ave
Your Personal Tour Guide
Ask me questions while you tour the home.