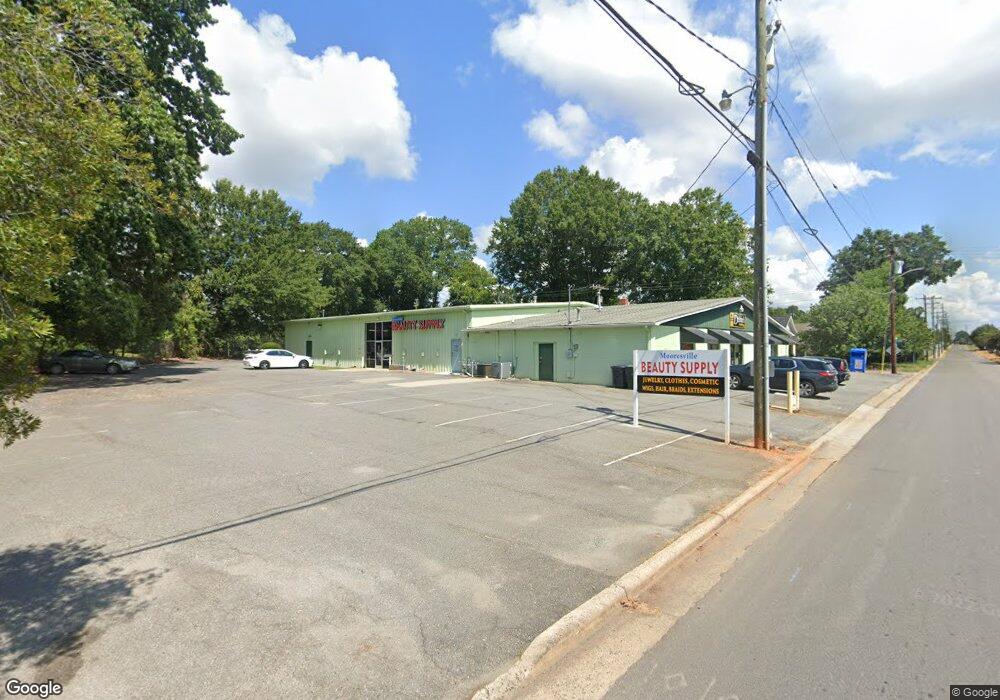
735 S Broad St Unit Suite A Mooresville, NC 28115
Estimated Value: $1,050,055
--
Bed
1
Bath
10,400
Sq Ft
$101/Sq Ft
Est. Value
About This Home
This home is located at 735 S Broad St Unit Suite A, Mooresville, NC 28115 and is currently priced at $1,050,055, approximately $100 per square foot. 735 S Broad St Unit Suite A is a home located in Iredell County with nearby schools including South Elementary School, Mooresville Intermediate School, and Mooresville Middle.
Ownership History
Date
Name
Owned For
Owner Type
Purchase Details
Closed on
Jan 31, 2025
Sold by
Ha Ha Roberts Limited Partnership
Bought by
Ryan Ko Llc
Current Estimated Value
Home Financials for this Owner
Home Financials are based on the most recent Mortgage that was taken out on this home.
Original Mortgage
$1,500,000
Outstanding Balance
$1,500,000
Interest Rate
6.72%
Mortgage Type
New Conventional
Purchase Details
Closed on
Mar 13, 2006
Sold by
Slade Inc
Bought by
Ha Ha Roberts Lp
Home Financials for this Owner
Home Financials are based on the most recent Mortgage that was taken out on this home.
Original Mortgage
$400,000
Interest Rate
7.5%
Mortgage Type
Commercial
Purchase Details
Closed on
Sep 1, 1995
Purchase Details
Closed on
Jul 1, 1995
Purchase Details
Closed on
Feb 1, 1993
Purchase Details
Closed on
Jun 1, 1970
Create a Home Valuation Report for This Property
The Home Valuation Report is an in-depth analysis detailing your home's value as well as a comparison with similar homes in the area
Home Values in the Area
Average Home Value in this Area
Purchase History
| Date | Buyer | Sale Price | Title Company |
|---|---|---|---|
| Ryan Ko Llc | $1,200,000 | None Listed On Document | |
| Ha Ha Roberts Lp | $443,750 | Colonial Title Company | |
| -- | $167,000 | -- | |
| -- | $2,000 | -- | |
| -- | -- | -- | |
| -- | -- | -- |
Source: Public Records
Mortgage History
| Date | Status | Borrower | Loan Amount |
|---|---|---|---|
| Open | Ryan Ko Llc | $1,500,000 | |
| Previous Owner | Ha Ha Roberts Lp | $277,418 | |
| Previous Owner | Ha Ha Roberts Lp | $400,000 | |
| Previous Owner | Slade Inc | $950,400 |
Source: Public Records
Tax History Compared to Growth
Tax History
| Year | Tax Paid | Tax Assessment Tax Assessment Total Assessment is a certain percentage of the fair market value that is determined by local assessors to be the total taxable value of land and additions on the property. | Land | Improvement |
|---|---|---|---|---|
| 2024 | $5,933 | $521,060 | $159,600 | $361,460 |
| 2023 | $5,620 | $493,560 | $159,600 | $333,960 |
| 2022 | $4,704 | $361,130 | $159,600 | $201,530 |
| 2021 | $4,704 | $361,130 | $159,600 | $201,530 |
| 2020 | $4,704 | $361,130 | $159,600 | $201,530 |
| 2019 | $4,668 | $361,130 | $159,600 | $201,530 |
| 2018 | $4,665 | $360,890 | $174,000 | $186,890 |
| 2017 | $4,665 | $360,890 | $174,000 | $186,890 |
| 2016 | $4,665 | $360,890 | $174,000 | $186,890 |
| 2015 | $4,665 | $360,890 | $174,000 | $186,890 |
| 2014 | $5,855 | $468,380 | $326,420 | $141,960 |
Source: Public Records
Map
Nearby Homes
- 110 Club Dr
- 303 Parker Ave
- 115 Haddington Place
- 313 Bruce Ave
- 337 Brawley Ave
- 630 Smith St Unit B
- 620 Smith St Unit A
- 616 Smith St Unit A
- 436 E Mills Ave
- 434 E Mills Ave
- 432 E Mills Ave
- 000 Ridge Ave
- 459 W Lowrance Ave
- 555 Ridge Ave
- 000 Young St
- 430 E Mills Ave
- 1053 Muirfield Dr
- 520 Shearers Rd
- 459 Towell St
- 553 W Lowrance Ave
- 220 W Pressley Ave
- 727 S Broad St
- 213 W Pressley Ave
- 219 W Pressley Ave
- 721 S Broad St
- 212 W Gray Ave
- 223 W Pressley Ave
- 218 W Gray Ave
- 730 S Main St
- 724 S Main St
- 736 S Main St
- 222 W Gray Ave
- 711 S Broad St
- 229 W Pressley Ave
- 213 W Gray Ave
- 716 S Main St
- 219 W Gray Ave
- 228 W Gray Ave
- 804 S Main St
- 710 S Main St