
Seller's Agent in 2025
Sandra Mariottini
Fulton Grace Realty
(773) 294-3739
17 in this area
53 Total Sales
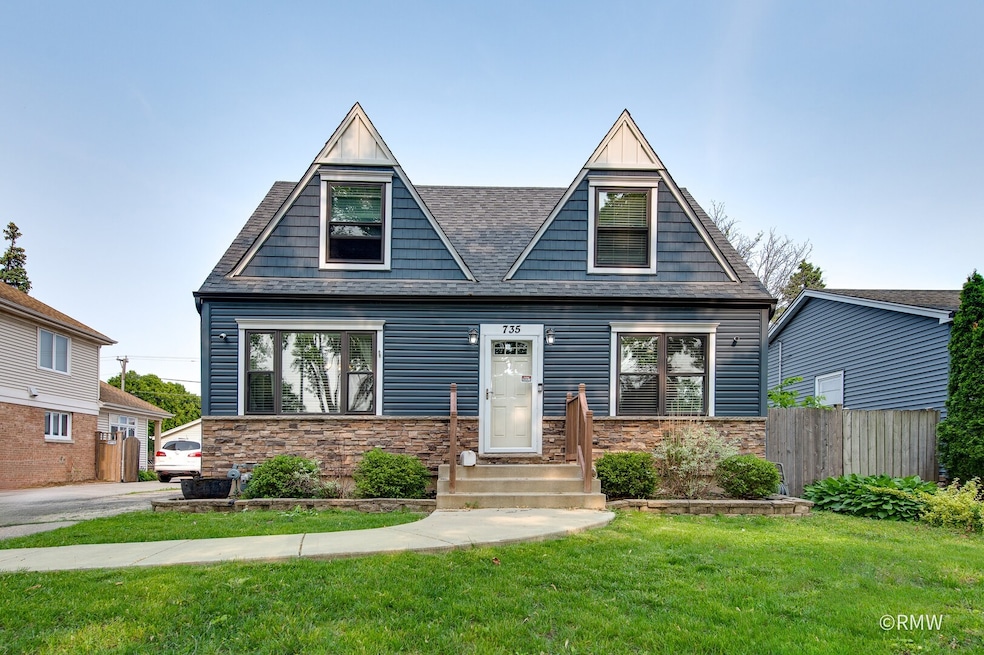
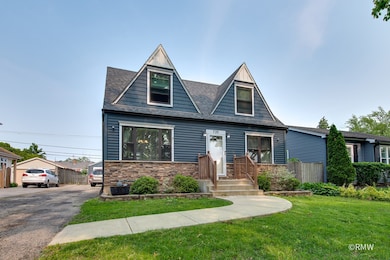
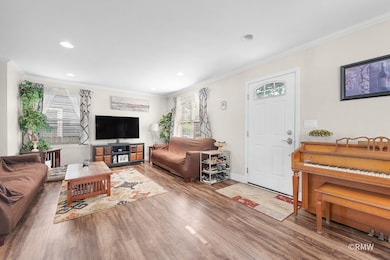
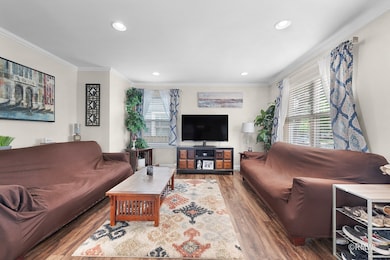
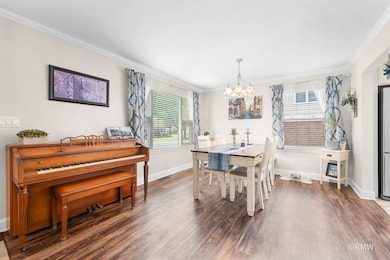
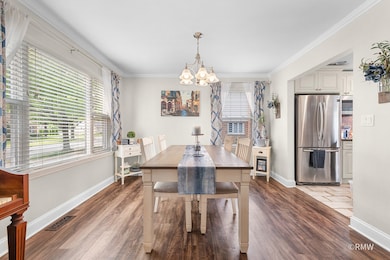
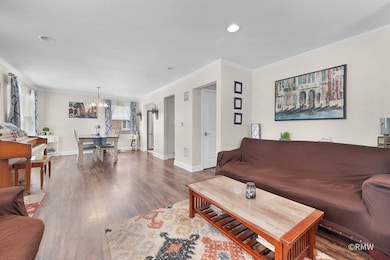
Stunning Renovated Home in Prime Spring Road Location - Lincoln School District! This beautifully updated 3-bedroom, 2 full and 2 half-bath home has been completely redone in 2018, offering modern living with timeless charm. Updates include: Chef's Kitchen with new cabinets, granite countertops, and a premium 5-burner Bertazzoni stove All-New Bathrooms, including a luxurious steam shower on the second level Modern Comforts like recessed lighting, crown molding on the 1st floor, new windows, doors, siding, roof, gutters, A/C, furnace, and electrical box High-Speed Connectivity with hardwired Cat 10 and a central data box Solid Infrastructure including a drain tile system and reinforced foundation for peace of mind Fully Finished Basement with laundry room and ample extra storage Private Outdoor Space featuring a fenced yard, paver patio, and a detached 2-car garage Located on vibrant Spring Road and within the sought-after Lincoln School District, this move-in-ready home blends high-end finishes with exceptional convenience.
Last Agent to Sell the Property
Fulton Grace Realty License #471012649 Listed on: 06/03/2025
Last Buyer's Agent
Berkshire Hathaway HomeServices Starck Real Estate License #475151433
| Date | Type | Sale Price | Title Company |
|---|---|---|---|
| Warranty Deed | $490,000 | Chicago Title | |
| Warranty Deed | -- | Midwest Title & Appraisal Se | |
| Interfamily Deed Transfer | -- | None Available | |
| Administrators Deed | $130,000 | Mid America Title Company |
| Date | Status | Loan Amount | Loan Type |
|---|---|---|---|
| Open | $392,000 | New Conventional | |
| Previous Owner | $198,000 | New Conventional | |
| Previous Owner | $100,000 | Purchase Money Mortgage |
| Date | Event | Price | List to Sale | Price per Sq Ft |
|---|---|---|---|---|
| 08/26/2025 08/26/25 | Sold | $490,000 | -1.8% | $404 / Sq Ft |
| 06/20/2025 06/20/25 | Pending | -- | -- | -- |
| 06/03/2025 06/03/25 | For Sale | $499,000 | -- | $412 / Sq Ft |
| Year | Tax Paid | Tax Assessment Tax Assessment Total Assessment is a certain percentage of the fair market value that is determined by local assessors to be the total taxable value of land and additions on the property. | Land | Improvement |
|---|---|---|---|---|
| 2024 | $7,673 | $127,313 | $62,548 | $64,765 |
| 2023 | $7,147 | $117,730 | $57,840 | $59,890 |
| 2022 | $6,862 | $113,160 | $55,590 | $57,570 |
| 2021 | $6,698 | $110,350 | $54,210 | $56,140 |
| 2020 | $6,444 | $107,930 | $53,020 | $54,910 |
| 2019 | $6,321 | $102,620 | $50,410 | $52,210 |
| 2018 | $5,742 | $92,690 | $47,730 | $44,960 |
| 2017 | $5,627 | $88,320 | $45,480 | $42,840 |
| 2016 | $5,523 | $83,200 | $42,840 | $40,360 |
| 2015 | $5,486 | $77,510 | $39,910 | $37,600 |
| 2014 | $5,669 | $73,560 | $36,430 | $37,130 |
| 2013 | $5,603 | $74,590 | $36,940 | $37,650 |
Seller's Agent in 2025
Sandra Mariottini
Fulton Grace Realty
(773) 294-3739
17 in this area
53 Total Sales
Seller Co-Listing Agent in 2025
Angie Corcione
Fulton Grace Realty
(630) 205-9575
13 in this area
295 Total Sales
Buyer's Agent in 2025
Unlim Lee Fenner
Berkshire Hathaway HomeServices Starck Real Estate
(630) 272-6462
1 in this area
13 Total Sales
Source: Midwest Real Estate Data (MRED)
MLS Number: 12381734
APN: 06-11-422-003
Disclaimer: Certain information contained herein is derived from information provided by parties other than Homes.com. All information provided is deemed reliable, but is not guaranteed to be accurate and should be independently verified.
![]() Based on information submitted to the MLS GRID. All data is obtained from various sources and may not have been verified by broker or MLS GRID. Supplied Open House Information is subject to change without notice. All information should be independently reviewed and verified for accuracy. Properties may or may not be listed by the office/agent presenting the information. Some IDX listings have been excluded from this website.
Based on information submitted to the MLS GRID. All data is obtained from various sources and may not have been verified by broker or MLS GRID. Supplied Open House Information is subject to change without notice. All information should be independently reviewed and verified for accuracy. Properties may or may not be listed by the office/agent presenting the information. Some IDX listings have been excluded from this website.
Based on information submitted to the MLS GRID
Ask me questions while you tour the home.