NOT LISTED FOR SALE

735 Shelly Terrace Inverness, FL 34450

Estimated Value: $218,174 - $242,000

3 Beds
2 Baths
1,487 Sq Ft
$156/Sq Ft Est. Value

Last Sold April 06, 2021

Last sale price $155,000 $104 Per Sq Ft

Est. 50% increase in value since last sale

Current estimated payment $1,351/month

About This Home

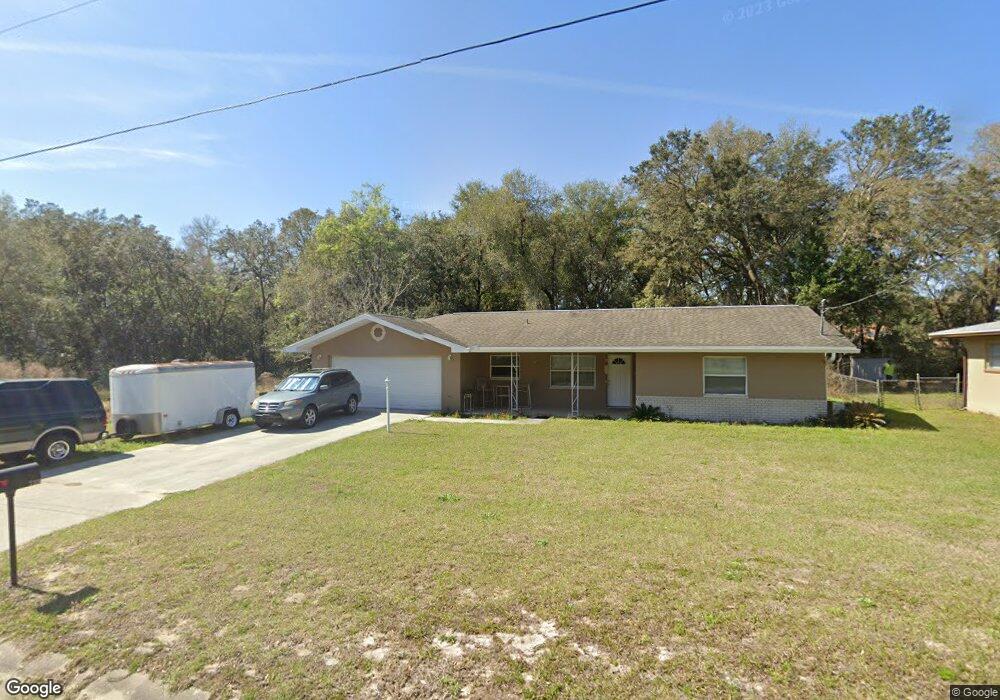
INVERNESS HIGHLANDS SOUTH - 3 Bedroom, 2 Bath, 2 Car Garage Home in Great Neighborhood. Freshly Painted Interior, New A/C in 2020, Re-Roofed in 2012. Split Floor Plan. Minutes to Downtown, Restaurants, Shopping, Schools, Parks, Boat Ramp, Bike/ Hiking Trail and Medical Facilities.

Ownership History

Date Name Owned For Owner Type

Purchase Details

Listed on
Feb 13, 2021
Closed on
Apr 6, 2021
Sold by
Ruano Elizabeth R
Bought by
Digiacomo Michael Joseph
Seller's Agent
J W Morton Property Management
Buyer's Agent
Deanna Hance
RE/MAX Champions
List Price
$155,000
Sold Price
$155,000
Current Estimated Value
$232,294

Home Financials for this Owner

Home Financials are based on the most recent Mortgage that was taken out on this home.
Estimated Appreciation
$77,294
Avg. Annual Appreciation
9.28%
Original Mortgage
$129,200
Outstanding Balance
$116,464
Interest Rate
2.9%
Mortgage Type
New Conventional
Estimated Equity
$115,830

Purchase Details

Closed on
Dec 21, 2004
Sold by
Wilson Jeffrey
Bought by
Ruano Elizabeth R

Purchase Details

Closed on
Nov 1, 2004
Bought by
Ruano Elizabeth R
Source: Public Records

Range of Values:

Collateral Analytics

Collateral Analytics Collateral Analytics AVMs (Automated Valuation Model) employ a number of statistical approaches combined with neighborhood-specific comparable selection guarantees the most up-to-date and precise valuations.

Not Available

Collateral Analytics does not have data for the current month. Please view the chart for historical values.

ICE

ICE Mortgage Technology ICE Mortgage Technology’s AVM (Automated Valuation Model) is a state-of-the-art online residential property valuation tool that provides a quick and accurate estimate of the value of almost any home in the U.S.

Not Available

ICE Mortgage Technology does not have data for the current month. Please view the chart for historical values.

First American

First American First American Data & Analytics’ next-generation AVM combines unrivaled data assets with a blended ensemble of valuation models to produce highly accurate, reliable valuations you can trust.

Not Available

First American does not have data for the current month. Please view the chart for historical values.

Quantarium

Quantarium Quantarium’s valuation service, repeatedly proven the industry’s most accurate and comprehensive, is supercharged with a self-learning and auto-tuning AI engine that continually becomes smarter and more accurate as it processes daily inputs from the industry’s leading RE data lake.

Not Available

Quantarium does not have data for the current month. Please view the chart for historical values.

Average Value
Not Available
List Price
Sold Price
Create a Home Valuation Report for This Property
The Home Valuation Report is an in-depth analysis detailing your home's value as well as a comparison with similar homes in the area

Home Values in the Area

Source: Public Records

Average Home Value in this Area


Source: Public Records

Purchase History

Date Buyer Sale Price Title Company
Digiacomo Michael Joseph $155,000 American Ttl Svcs Of Citrus
Ruano Elizabeth R -- American Title Services Of C
Ruano Elizabeth R $100 --
Source: Public Records

Mortgage History

Date Status Borrower Loan Amount
Open Digiacomo Michael Joseph $129,200
Source: Public Records

Property History

Date Event Price List to Sale Price per Sq Ft Prior Sale
04/06/2021 04/06/21 Sold $155,000 0.0% $104 / Sq Ft View Prior Sale
03/07/2021 03/07/21 Pending -- -- --
02/13/2021 02/13/21 For Sale $155,000 0.0% $104 / Sq Ft
04/18/2017 04/18/17 Rented $900 0.0% --
04/18/2017 04/18/17 For Rent $900 -- --

Tax History Compared to Growth

Source: Public Records

Tax History

Year Tax Paid Tax Assessment Tax Assessment Total Assessment is a certain percentage of the fair market value that is determined by local assessors to be the total taxable value of land and additions on the property. Land Improvement
2024 $1,619 $142,129 -- --
2023 $1,619 $137,989 $0 $0
2022 $1,514 $133,970 $7,440 $126,530
2021 $1,484 $97,976 $4,320 $93,656
2020 $1,324 $88,893 $3,520 $85,373
2019 $1,263 $86,224 $3,520 $82,704
2018 $1,128 $73,587 $3,200 $70,387
2017 $1,026 $62,583 $2,840 $59,743
2016 $988 $58,871 $2,580 $56,291
2015 $897 $50,040 $2,310 $47,730
2014 $887 $47,770 $4,218 $43,552
Source: Public Records

Agents Affiliated with this Home

  • Section Image
  • Section Image
See All Agents

Map