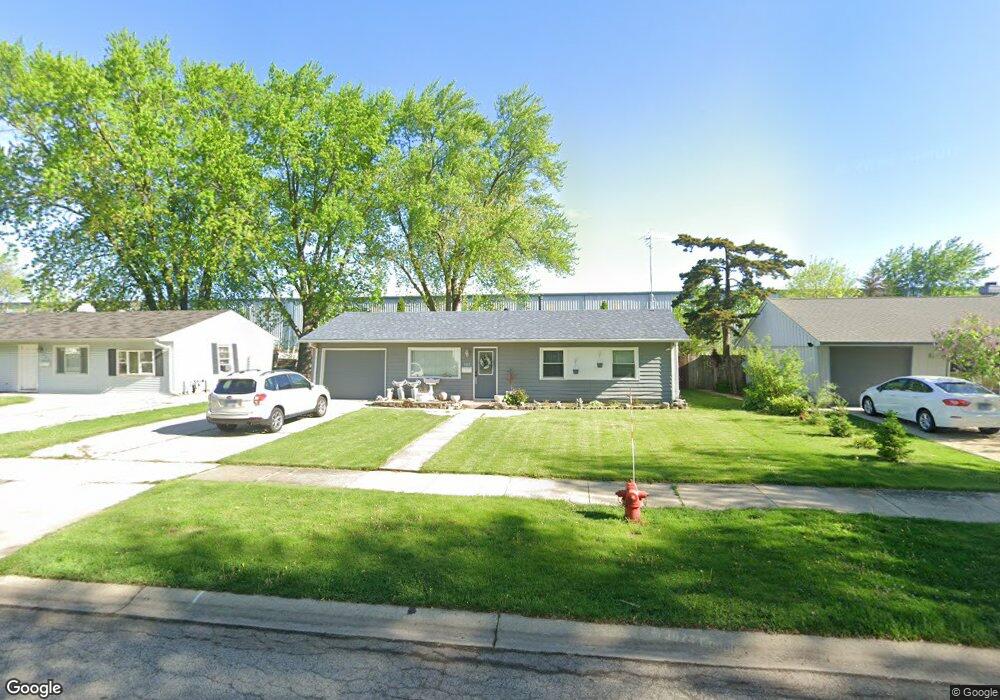
735 Tinley Dr Unit 4 Aurora, IL 60506
North River NeighborhoodEstimated Value: $257,000 - $267,000
3
Beds
1
Bath
925
Sq Ft
$284/Sq Ft
Est. Value
About This Home
This home is located at 735 Tinley Dr Unit 4, Aurora, IL 60506 and is currently estimated at $262,316, approximately $283 per square foot. 735 Tinley Dr Unit 4 is a home located in Kane County with nearby schools including Fearn Elementary School, Jewel Middle School, and West Aurora High School.
Ownership History
Date
Name
Owned For
Owner Type
Purchase Details
Closed on
Sep 13, 2011
Sold by
Hayward Leland and Lee Mary
Bought by
Zuno Socorro M
Current Estimated Value
Home Financials for this Owner
Home Financials are based on the most recent Mortgage that was taken out on this home.
Original Mortgage
$91,617
Outstanding Balance
$62,709
Interest Rate
4.25%
Mortgage Type
FHA
Estimated Equity
$199,607
Create a Home Valuation Report for This Property
The Home Valuation Report is an in-depth analysis detailing your home's value as well as a comparison with similar homes in the area
Home Values in the Area
Average Home Value in this Area
Purchase History
| Date | Buyer | Sale Price | Title Company |
|---|---|---|---|
| Zuno Socorro M | $94,000 | First American Title |
Source: Public Records
Mortgage History
| Date | Status | Borrower | Loan Amount |
|---|---|---|---|
| Open | Zuno Socorro M | $91,617 |
Source: Public Records
Tax History Compared to Growth
Tax History
| Year | Tax Paid | Tax Assessment Tax Assessment Total Assessment is a certain percentage of the fair market value that is determined by local assessors to be the total taxable value of land and additions on the property. | Land | Improvement |
|---|---|---|---|---|
| 2024 | $4,406 | $63,645 | $13,260 | $50,385 |
| 2023 | $4,186 | $56,867 | $11,848 | $45,019 |
| 2022 | $4,062 | $51,886 | $10,810 | $41,076 |
| 2021 | $3,865 | $48,306 | $10,064 | $38,242 |
| 2020 | $4,282 | $51,738 | $9,348 | $42,390 |
| 2019 | $4,101 | $47,936 | $8,661 | $39,275 |
| 2018 | $3,699 | $43,058 | $8,011 | $35,047 |
| 2017 | $3,438 | $39,402 | $7,381 | $32,021 |
| 2016 | $3,126 | $35,430 | $6,327 | $29,103 |
| 2015 | -- | $30,916 | $5,441 | $25,475 |
| 2014 | -- | $28,888 | $5,233 | $23,655 |
| 2013 | -- | $30,142 | $5,158 | $24,984 |
Source: Public Records
Map
Nearby Homes
- 1563 Cambridge Ave
- 1059 Scarlet Oak Cir
- 3 Lovedale Ln
- 929 Southbridge Dr
- 910 Southbridge Dr
- 307 John St
- 320 Harmony Dr
- 306 Harmony Dr
- 16 S Grace St
- 328 W State St
- 1041 N Elmwood Dr
- 43 S Juniper Dr Unit 3
- 6 S Sycamore Ln
- 24 S Grant St
- 12 N Lincolnway
- 1069 Legrande Ave
- 327 Lakelawn Blvd
- 925 Darwin St
- 1045 Palace St
- 563 California Ave
- 731 Tinley Dr Unit 4
- 741 Tinley Dr
- 725 Tinley Dr
- 745 Tinley Dr Unit 5
- 732 Tinley Dr Unit 4
- 721 Tinley Dr
- 728 Tinley Dr
- 751 Tinley Dr
- 742 Tinley Dr
- 722 Tinley Dr
- 715 Tinley Dr
- 748 Tinley Dr
- 718 Tinley Dr
- 755 Tinley Dr
- 752 Tinley Dr
- 731 Calico Dr
- 709 Tinley Dr
- 737 Calico Dr Unit 5
- 712 Tinley Dr
- 727 Calico Dr