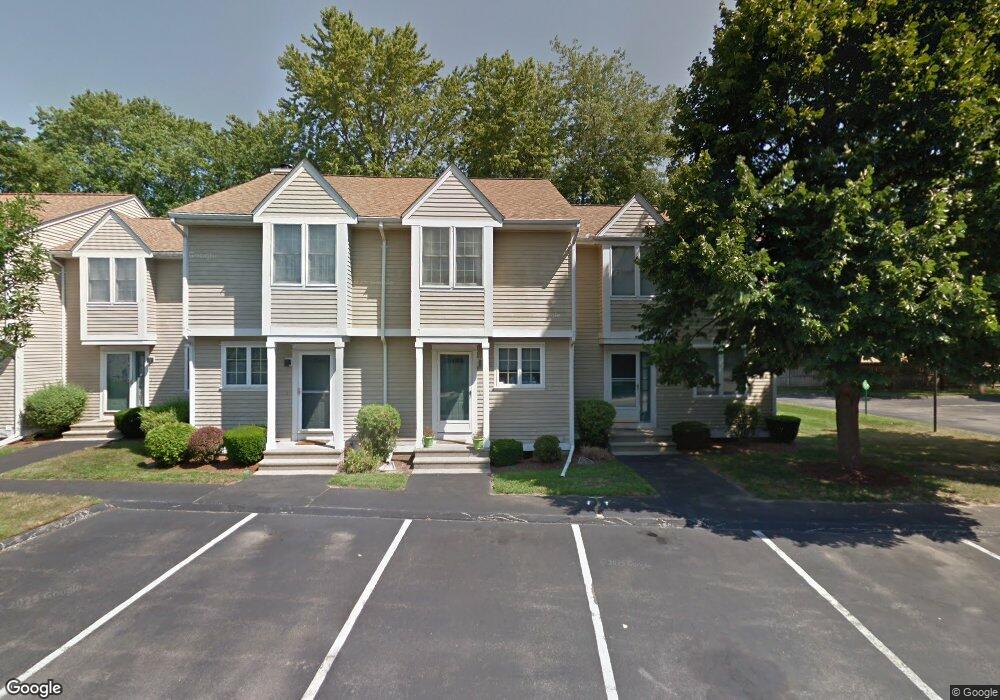
735 Willett Ave Unit 402 Riverside, RI 02915
Riverside NeighborhoodEstimated Value: $354,567 - $373,000
2
Beds
2
Baths
1,116
Sq Ft
$324/Sq Ft
Est. Value
About This Home
This home is located at 735 Willett Ave Unit 402, Riverside, RI 02915 and is currently estimated at $362,142, approximately $324 per square foot. 735 Willett Ave Unit 402 is a home located in Providence County with nearby schools including East Providence High School, St Luke Elementary School, and St Mary Academy-Bay View.
Ownership History
Date
Name
Owned For
Owner Type
Purchase Details
Closed on
May 2, 2005
Sold by
Cunningham John P
Bought by
Oliver Karen A
Current Estimated Value
Home Financials for this Owner
Home Financials are based on the most recent Mortgage that was taken out on this home.
Original Mortgage
$173,600
Outstanding Balance
$90,572
Interest Rate
5.95%
Mortgage Type
Purchase Money Mortgage
Estimated Equity
$271,570
Purchase Details
Closed on
Dec 28, 1995
Sold by
Scharver Chris M and Aloisio Brenda L
Bought by
Irwin David P
Home Financials for this Owner
Home Financials are based on the most recent Mortgage that was taken out on this home.
Original Mortgage
$96,450
Interest Rate
7.33%
Purchase Details
Closed on
Apr 27, 1990
Sold by
Bowen Court Assoc
Bought by
Scharver Chris M
Home Financials for this Owner
Home Financials are based on the most recent Mortgage that was taken out on this home.
Original Mortgage
$107,000
Interest Rate
10.26%
Create a Home Valuation Report for This Property
The Home Valuation Report is an in-depth analysis detailing your home's value as well as a comparison with similar homes in the area
Home Values in the Area
Average Home Value in this Area
Purchase History
| Date | Buyer | Sale Price | Title Company |
|---|---|---|---|
| Oliver Karen A | $217,000 | -- | |
| Irwin David P | $101,000 | -- | |
| Scharver Chris M | $119,000 | -- |
Source: Public Records
Mortgage History
| Date | Status | Borrower | Loan Amount |
|---|---|---|---|
| Open | Scharver Chris M | $173,600 | |
| Previous Owner | Scharver Chris M | $96,450 | |
| Previous Owner | Scharver Chris M | $107,000 |
Source: Public Records
Tax History Compared to Growth
Tax History
| Year | Tax Paid | Tax Assessment Tax Assessment Total Assessment is a certain percentage of the fair market value that is determined by local assessors to be the total taxable value of land and additions on the property. | Land | Improvement |
|---|---|---|---|---|
| 2025 | $4,137 | $316,500 | $0 | $316,500 |
| 2024 | $3,719 | $242,600 | $0 | $242,600 |
| 2023 | $3,581 | $242,600 | $0 | $242,600 |
| 2022 | $4,324 | $197,800 | $600 | $197,200 |
| 2021 | $4,253 | $197,800 | $0 | $197,800 |
| 2020 | $4,073 | $197,800 | $0 | $197,800 |
| 2019 | $3,960 | $197,800 | $0 | $197,800 |
| 2018 | $2,855 | $124,800 | $0 | $124,800 |
| 2017 | $2,792 | $124,800 | $0 | $124,800 |
| 2016 | $2,778 | $124,800 | $0 | $124,800 |
| 2015 | $2,926 | $127,500 | $0 | $127,500 |
| 2014 | $2,926 | $127,500 | $0 | $127,500 |
Source: Public Records
Map
Nearby Homes
- 735 Willett Ave Unit 704
- 735 Willett Ave Unit 301
- 735 Willett Ave Unit 205
- 735 Willett Ave Unit 206
- 735 Willett Ave Unit 703
- 735 Willett Ave Unit 906
- 735 Willett Ave Unit 503
- 735 Willett Ave Unit 905
- 735 Willett Ave Unit 502
- 735 Willett Ave Unit 103
- 735 Willett Ave Unit 108
- 735 Willett Ave Unit 803
- 735 Willett Ave Unit 602
- 735 Willett Ave Unit 105
- 735 Willett Ave Unit 102
- 735 Willett Ave Unit 308
- 735 Willett Ave Unit 204
- 735 Willett Ave Unit 904
- 735 Willett Ave Unit 107
- 735 Willett Ave Unit 404