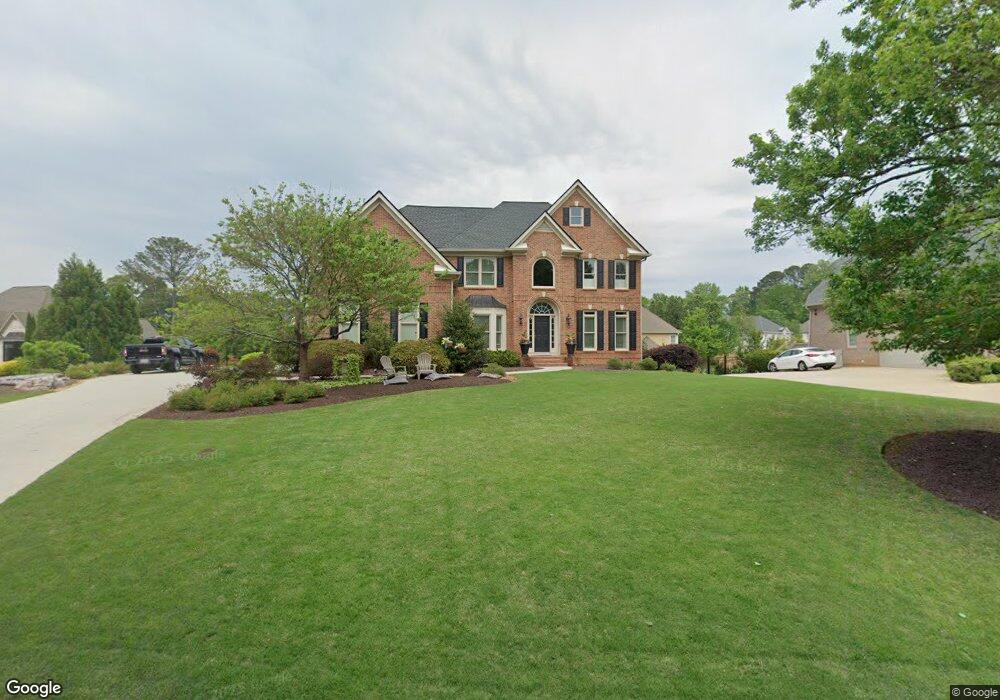
7350 Richmond Way Cumming, GA 30040
Estimated Value: $884,526 - $1,024,000
6
Beds
6
Baths
3,282
Sq Ft
$292/Sq Ft
Est. Value
About This Home
This home is located at 7350 Richmond Way, Cumming, GA 30040 and is currently estimated at $959,632, approximately $292 per square foot. 7350 Richmond Way is a home located in Forsyth County with nearby schools including Vickery Creek Middle School, West Forsyth High School, and Montessori at Vickery.
Ownership History
Date
Name
Owned For
Owner Type
Purchase Details
Closed on
Aug 19, 2005
Sold by
Crawford Nita C
Bought by
Demarco John R and Demarco Lisa
Current Estimated Value
Home Financials for this Owner
Home Financials are based on the most recent Mortgage that was taken out on this home.
Original Mortgage
$30,500
Outstanding Balance
$15,212
Interest Rate
4.88%
Mortgage Type
New Conventional
Estimated Equity
$944,420
Purchase Details
Closed on
Jan 22, 1998
Sold by
Rubrecht William W and Rubrecht Linda K
Bought by
Crawford Nita C
Home Financials for this Owner
Home Financials are based on the most recent Mortgage that was taken out on this home.
Original Mortgage
$160,000
Interest Rate
7.07%
Mortgage Type
New Conventional
Purchase Details
Closed on
Dec 2, 1996
Sold by
Haven Prop Inc
Bought by
Rubrecht William Linda
Create a Home Valuation Report for This Property
The Home Valuation Report is an in-depth analysis detailing your home's value as well as a comparison with similar homes in the area
Home Values in the Area
Average Home Value in this Area
Purchase History
| Date | Buyer | Sale Price | Title Company |
|---|---|---|---|
| Demarco John R | $496,000 | -- | |
| Crawford Nita C | $354,000 | -- | |
| Rubrecht William Linda | $350,000 | -- |
Source: Public Records
Mortgage History
| Date | Status | Borrower | Loan Amount |
|---|---|---|---|
| Open | Demarco John R | $30,500 | |
| Previous Owner | Crawford Nita C | $160,000 | |
| Closed | Rubrecht William Linda | $0 |
Source: Public Records
Tax History Compared to Growth
Tax History
| Year | Tax Paid | Tax Assessment Tax Assessment Total Assessment is a certain percentage of the fair market value that is determined by local assessors to be the total taxable value of land and additions on the property. | Land | Improvement |
|---|---|---|---|---|
| 2025 | $6,732 | $341,172 | $68,000 | $273,172 |
| 2024 | $6,732 | $333,320 | $68,000 | $265,320 |
| 2023 | $6,252 | $323,504 | $62,000 | $261,504 |
| 2022 | $6,140 | $216,628 | $44,000 | $172,628 |
| 2021 | $5,413 | $216,628 | $44,000 | $172,628 |
| 2020 | $5,011 | $197,176 | $34,000 | $163,176 |
| 2019 | $4,992 | $195,880 | $34,000 | $161,880 |
| 2018 | $5,102 | $200,148 | $34,000 | $166,148 |
| 2017 | $4,954 | $192,232 | $30,000 | $162,232 |
| 2016 | $4,677 | $179,112 | $26,000 | $153,112 |
| 2015 | $4,670 | $178,392 | $26,000 | $152,392 |
| 2014 | $4,170 | $165,260 | $0 | $0 |
Source: Public Records
Map
Nearby Homes
- 7340 Richmond Way
- 7370 Richmond Way
- 0 Richmond Way Unit 8712711
- 0 Richmond Way Unit 8889153
- 0 Richmond Way Unit 7486375
- 0 Richmond Way Unit 7554609
- 0 Richmond Way Unit 8025655
- 7425 Dover Place
- 7415 Dover Place
- 7355 Richmond Way Unit includingutilities-2
- 7355 Richmond Way
- 7355 Richmond Way
- 7345 Richmond Way
- 7330 Richmond Way
- 7365 Richmond Way
- 7380 Richmond Way
- 7335 Polo Hill
- 7345 Polo Hill
- 7420 Dover Place
- 7335 Richmond Way