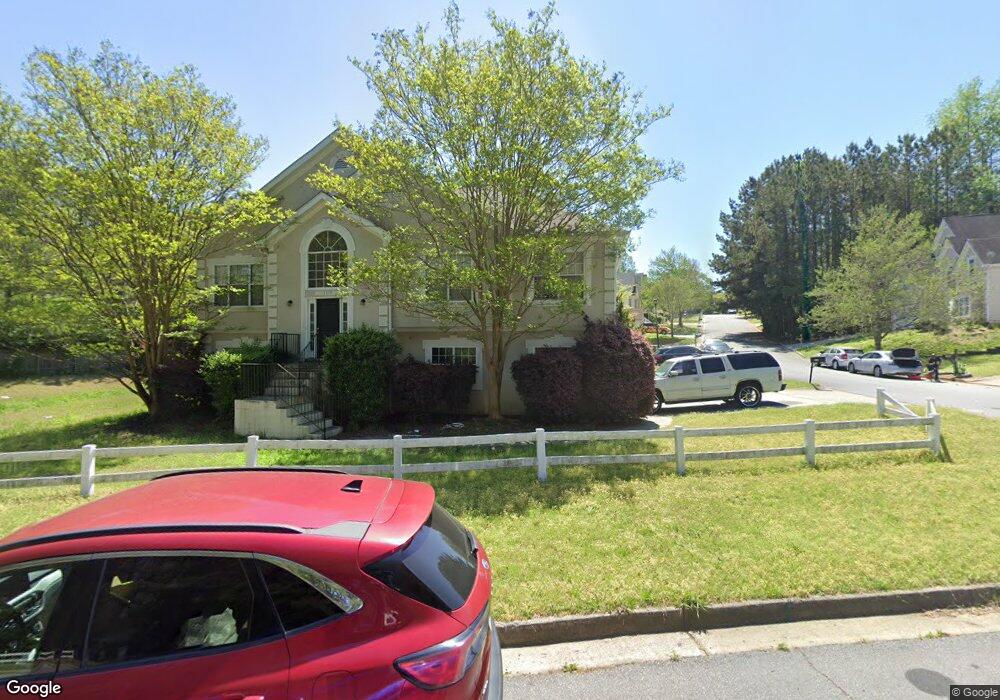
7350 Royale Ln Riverdale, GA 30296
Estimated Value: $232,000 - $291,000
4
Beds
3
Baths
1,592
Sq Ft
$170/Sq Ft
Est. Value
About This Home
This home is located at 7350 Royale Ln, Riverdale, GA 30296 and is currently estimated at $269,845, approximately $169 per square foot. 7350 Royale Ln is a home located in Fulton County with nearby schools including Nolan Elementary School, Mcnair Middle School, and Banneker High School.
Ownership History
Date
Name
Owned For
Owner Type
Purchase Details
Closed on
Apr 9, 2025
Sold by
Home Sfr Borrower Iii Llc
Bought by
Fyr Sfr Borrower Llc
Current Estimated Value
Purchase Details
Closed on
Oct 12, 2016
Sold by
Tah 2015 1 Borrower Llc
Bought by
Mupr 3 Assets Llc
Purchase Details
Closed on
May 12, 2015
Sold by
Castle Atlanta Holding Lp
Bought by
Tah 2015 1 Borrower Llc
Purchase Details
Closed on
Feb 4, 2014
Sold by
Riley Georgia
Bought by
Castle Atlanta Holding Lp
Purchase Details
Closed on
Oct 6, 2005
Sold by
Household Realty Corp
Bought by
Riley Georgia A
Home Financials for this Owner
Home Financials are based on the most recent Mortgage that was taken out on this home.
Original Mortgage
$115,900
Interest Rate
5.76%
Mortgage Type
New Conventional
Purchase Details
Closed on
Jun 7, 2005
Sold by
Hayford Terri
Bought by
Household Realty Corp
Create a Home Valuation Report for This Property
The Home Valuation Report is an in-depth analysis detailing your home's value as well as a comparison with similar homes in the area
Home Values in the Area
Average Home Value in this Area
Purchase History
| Date | Buyer | Sale Price | Title Company |
|---|---|---|---|
| Fyr Sfr Borrower Llc | -- | -- | |
| Mupr 3 Assets Llc | $159,500 | -- | |
| Tah 2015 1 Borrower Llc | -- | -- | |
| Castle Atlanta Holding Lp | $61,901 | -- | |
| Riley Georgia A | $144,900 | -- | |
| Household Realty Corp | $133,722 | -- |
Source: Public Records
Mortgage History
| Date | Status | Borrower | Loan Amount |
|---|---|---|---|
| Previous Owner | Riley Georgia A | $115,900 |
Source: Public Records
Tax History Compared to Growth
Tax History
| Year | Tax Paid | Tax Assessment Tax Assessment Total Assessment is a certain percentage of the fair market value that is determined by local assessors to be the total taxable value of land and additions on the property. | Land | Improvement |
|---|---|---|---|---|
| 2025 | $5,289 | $134,520 | $33,200 | $101,320 |
| 2023 | $3,410 | $120,800 | $27,680 | $93,120 |
| 2022 | $4,208 | $107,320 | $21,920 | $85,400 |
| 2021 | $2,940 | $73,440 | $10,120 | $63,320 |
| 2020 | $2,315 | $72,600 | $10,000 | $62,600 |
| 2019 | $2,246 | $56,880 | $6,280 | $50,600 |
| 2018 | $2,210 | $55,520 | $6,120 | $49,400 |
| 2017 | $1,262 | $30,960 | $5,800 | $25,160 |
| 2016 | $1,262 | $30,960 | $5,800 | $25,160 |
| 2015 | $1,051 | $24,760 | $5,160 | $19,600 |
| 2014 | $460 | $30,960 | $5,800 | $25,160 |
Source: Public Records
Map
Nearby Homes
- 7365 Royale Ln
- 500 Kings Place
- 340 Kings Place
- 7455 Royal Ct
- 2255 Lake Royale Dr
- 315 Lake Royale Place
- 2350 Lake Royale Dr
- 4009 Highway 138 SW
- 1929 Seneca Ct
- 7270 Oswego Trail
- 2367 Garnet Ave
- 1901 Cherwell Dr
- 752 Jasper Cove
- 375 Sapphire Bend
- 7179 Bryce Rd
- 2454 West Rd
- 0 Old National Hwy Unit 7196041
- 110 Chippewa Ct
- 7125 W Fayetteville Rd
- 7360 Royale Ln
- 7380 Royale Ln
- 7370 Royale Ln
- 7390 Royale Ln
- 7385 Royale Ln
- 7355 Royale Ln
- 0 Royale Ln Unit 8968092
- 0 Royale Ln Unit 7103877
- 0 Royale Ln Unit 3261339
- 0 Royale Ln Unit 3216146
- 0 Royale Ln Unit 8661581
- 0 Royale Ln Unit 8667801
- 0 Royale Ln Unit 8552535
- 0 Royale Ln Unit 8079345
- 0 Royale Ln Unit 7461983
- 0 Royale Ln Unit 3198371
- 0 Royale Ln Unit 7138712
- 0 Royale Ln Unit 3119572
- 720 Queens Ct
- 710 Queens Ct