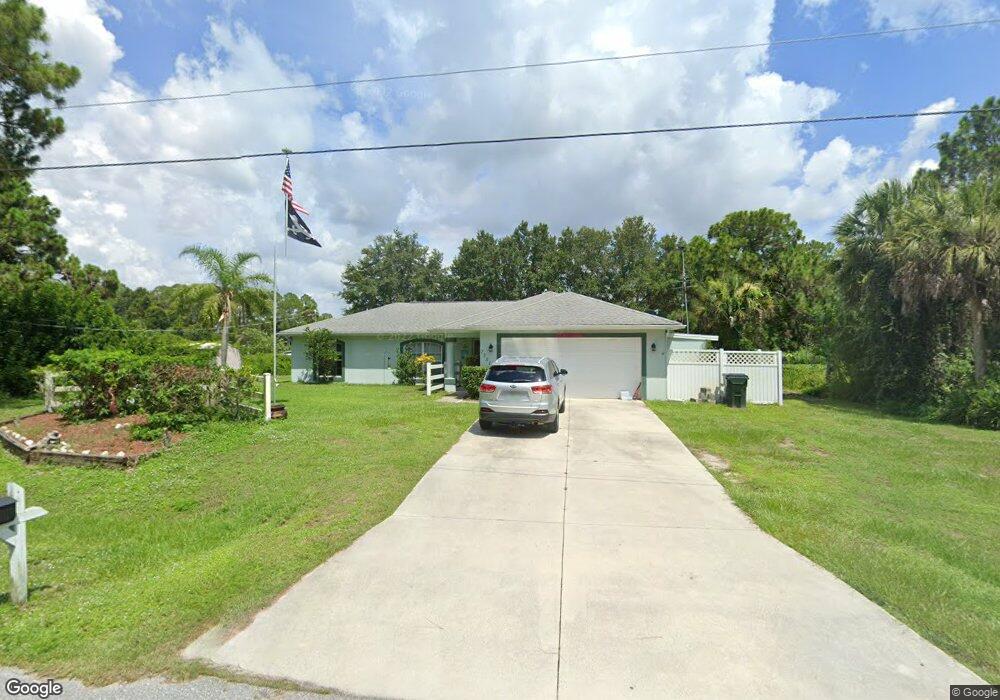
7351 Rockwell Ave North Port, FL 34291
Estimated Value: $308,000 - $353,000
3
Beds
2
Baths
1,241
Sq Ft
$267/Sq Ft
Est. Value
About This Home
This home is located at 7351 Rockwell Ave, North Port, FL 34291 and is currently estimated at $331,895, approximately $267 per square foot. 7351 Rockwell Ave is a home located in Sarasota County with nearby schools including Glenallen Elementary School, North Port High School, and Heron Creek Middle School.
Ownership History
Date
Name
Owned For
Owner Type
Purchase Details
Closed on
Sep 2, 2021
Sold by
Reynolds Kevin J and Reynolds Kevin
Bought by
Matzke Erick and Matzke Shelly
Current Estimated Value
Home Financials for this Owner
Home Financials are based on the most recent Mortgage that was taken out on this home.
Original Mortgage
$236,250
Outstanding Balance
$214,970
Interest Rate
2.8%
Mortgage Type
New Conventional
Estimated Equity
$116,925
Purchase Details
Closed on
Oct 13, 2015
Sold by
St Onge Suzanne I
Bought by
Reynolds Kevin
Purchase Details
Closed on
Jun 6, 2003
Sold by
Windemere Homes Inc
Bought by
Stonge Suzanne I
Home Financials for this Owner
Home Financials are based on the most recent Mortgage that was taken out on this home.
Original Mortgage
$109,200
Interest Rate
5.68%
Purchase Details
Closed on
Aug 20, 2002
Sold by
Rutter Delmont H and Rutter Nancy R
Bought by
St Onge Suzanne I
Create a Home Valuation Report for This Property
The Home Valuation Report is an in-depth analysis detailing your home's value as well as a comparison with similar homes in the area
Home Values in the Area
Average Home Value in this Area
Purchase History
| Date | Buyer | Sale Price | Title Company |
|---|---|---|---|
| Matzke Erick | $315,000 | Accommodation | |
| Reynolds Kevin | $155,000 | Premier Title Of Florida | |
| Stonge Suzanne I | $121,500 | -- | |
| St Onge Suzanne I | $7,000 | -- |
Source: Public Records
Mortgage History
| Date | Status | Borrower | Loan Amount |
|---|---|---|---|
| Open | Matzke Erick | $236,250 | |
| Previous Owner | Stonge Suzanne I | $109,200 |
Source: Public Records
Tax History Compared to Growth
Tax History
| Year | Tax Paid | Tax Assessment Tax Assessment Total Assessment is a certain percentage of the fair market value that is determined by local assessors to be the total taxable value of land and additions on the property. | Land | Improvement |
|---|---|---|---|---|
| 2024 | $5,024 | $248,400 | $26,800 | $221,600 |
| 2023 | $5,024 | $293,300 | $36,600 | $256,700 |
| 2022 | $4,556 | $256,400 | $27,200 | $229,200 |
| 2021 | $3,334 | $170,400 | $11,800 | $158,600 |
| 2020 | $3,249 | $163,400 | $10,300 | $153,100 |
| 2019 | $3,119 | $155,900 | $12,500 | $143,400 |
| 2018 | $2,809 | $145,600 | $10,700 | $134,900 |
| 2017 | $2,748 | $140,500 | $7,400 | $133,100 |
| 2016 | $2,753 | $137,500 | $6,900 | $130,600 |
| 2015 | $1,379 | $116,300 | $6,200 | $110,100 |
| 2014 | $1,357 | $85,123 | $0 | $0 |
Source: Public Records
Map
Nearby Homes
- Lot 7 Paragon Rd
- Lot 8 Paragon Rd
- 7380 Meroni Blvd
- 7192 N Paragon Rd
- 0 Minardi St Unit MFRC7512307
- 4304 Mermell Cir
- 7478 Paragon Rd
- LOT 18 Batalla Rd
- 7466 Battalla Rd
- 7685 Rockwell Ave
- 2821 Embassy Rd
- Lot 17 Branham St
- 4357 Mermell Cir
- 2713 Embassy Rd
- 7635 Paragon Rd
- 4427 N Mermell Cir
- 7587 Jayman Rd
- 0 Jayman Rd Unit MFRA4664836
- 3284 Newmark St
- 4178 Mermell Cir
- 7237 Meroni Blvd
- 7270 Paragon Rd
- 7215 Meroni Blvd
- 7454 Rockwell Ave
- 7302 Meroni Blvd
- 3919 Royce St
- 7193 Meroni Blvd
- 3897 Royce St
- 7488 Rockwell Ave
- 7346 Meroni Blvd
- 7288 Sablon Rd
- 1 Paragon Rd
- 0 Royce St Unit MFRO6191173
- 0 Royce St Unit MFRA4596692
- 0 Royce St Unit MFRA4596693
- 0 Royce St Unit MFRA4580790
- 0 Royce St
- Lots 7 & 8 Paragon Rd
- 7173 Meroni Blvd
- 7522 Rockwell Ave