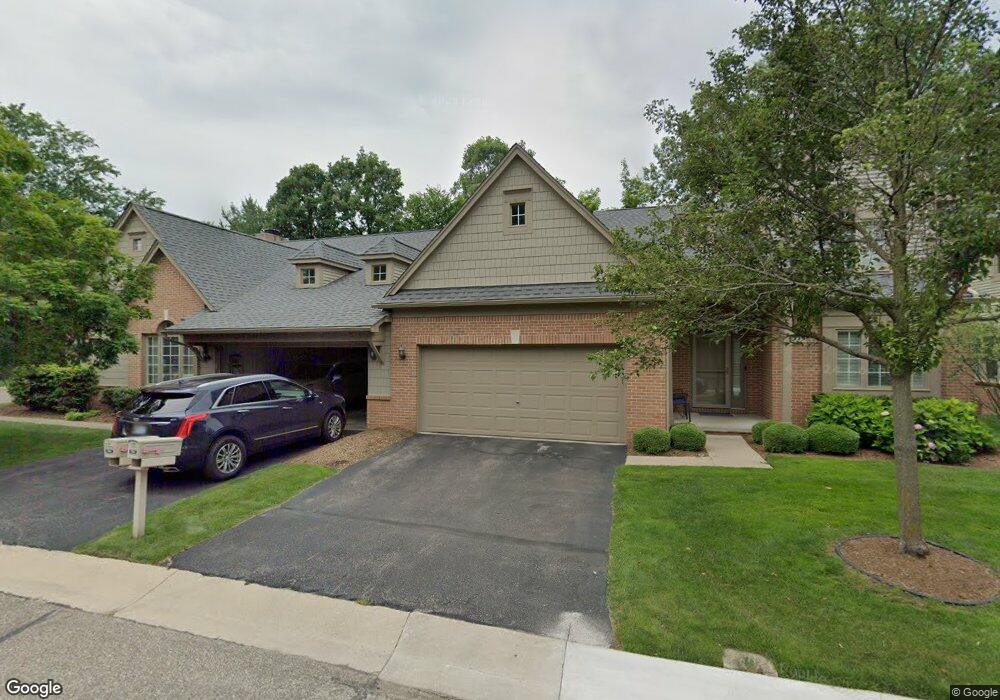
7354 Crackling Creek Cir Unit 2 West Bloomfield, MI 48322
Estimated Value: $476,306 - $621,000
3
Beds
3
Baths
2,513
Sq Ft
$216/Sq Ft
Est. Value
About This Home
This home is located at 7354 Crackling Creek Cir Unit 2, West Bloomfield, MI 48322 and is currently estimated at $543,077, approximately $216 per square foot. 7354 Crackling Creek Cir Unit 2 is a home located in Oakland County with nearby schools including Sheiko Elementary School, West Bloomfield Middle School, and Bloomfield Maples Montessori.
Ownership History
Date
Name
Owned For
Owner Type
Purchase Details
Closed on
Jan 22, 2025
Sold by
Brown Kenneth D and Brown Dionisia Myers
Bought by
Brown Kenneth D and Brown Dionisia Myers
Current Estimated Value
Purchase Details
Closed on
Feb 5, 2021
Sold by
Brown Kenneth D and Myers Dionsia
Bought by
Brown Kenneth D and Myers Dionsia
Purchase Details
Closed on
Nov 1, 2007
Sold by
Kang Shinae
Bought by
Brown Kenneth D and Myers Dionisia
Purchase Details
Closed on
Dec 8, 2000
Sold by
Townhomes At Maple Creek
Bought by
Kang Shiane
Create a Home Valuation Report for This Property
The Home Valuation Report is an in-depth analysis detailing your home's value as well as a comparison with similar homes in the area
Home Values in the Area
Average Home Value in this Area
Purchase History
| Date | Buyer | Sale Price | Title Company |
|---|---|---|---|
| Brown Kenneth D | -- | None Listed On Document | |
| Brown Kenneth D | -- | None Listed On Document | |
| Brown Kenneth D | -- | None Available | |
| Brown Kenneth D | $344,000 | Metropolitan | |
| Kang Shiane | -- | -- |
Source: Public Records
Tax History Compared to Growth
Tax History
| Year | Tax Paid | Tax Assessment Tax Assessment Total Assessment is a certain percentage of the fair market value that is determined by local assessors to be the total taxable value of land and additions on the property. | Land | Improvement |
|---|---|---|---|---|
| 2024 | $4,348 | $214,850 | $0 | $0 |
| 2022 | $4,163 | $205,000 | $39,380 | $165,620 |
| 2021 | $6,376 | $202,520 | $0 | $0 |
| 2020 | $4,079 | $188,960 | $39,380 | $149,580 |
| 2018 | $6,099 | $188,830 | $39,380 | $149,450 |
| 2015 | -- | $166,100 | $0 | $0 |
| 2014 | -- | $150,810 | $0 | $0 |
| 2011 | -- | $137,770 | $0 | $0 |
Source: Public Records
Map
Nearby Homes
- 6906 Pebblecreek Woods Dr
- 6953 Pebble Park Cir Unit 68
- 7406 Pebble Point
- 7187 Pebble Park Dr
- 7411 Pebble Point Unit 20
- 7114 Pebble Park Dr
- 7494 Pebble Ln Unit 118
- 7106 Bridge Way Unit 169
- 7122 Pebble Park Dr
- 7118 Pebble Park Dr
- 7490 Brynmawr Ct Unit 73
- 7233 Creeks Bend Dr
- 7258 Creeks Bend Ct
- 7159 Creeks Crossing Unit 47
- 7208 Creeks Bend Dr Unit 77
- 6651 Hearthside Ct Unit 1
- 6798 Andiron Ct
- 7174 Creeks Crossing
- 31935 W 14 Mile Rd Unit 234
- 31915 W 14 Mile Rd Unit 247
- 7330 Crackling Creek Cir Unit 4
- 7345 Crackling Creek Cir Unit 11 21
- 7345 Crackling Creek Cir
- 7345 Crackling Creek Cir Unit 21
- 7378 Crackling Creek Cir
- 7306 Crackling Creek Cir
- 7405 Crackling Creek Cir
- 7402 Crackling Creek Cir
- 7402 Crackling Creek Cir Unit 16, 32
- 7402 Crackling Creek Cir Unit 32
- 7273 Crackling Creek Cir
- 7270 Crackling Creek Cir Unit 9
- 7270 Crackling Creek Cir Unit 9-Bldg5
- 7414 Crackling Creek Cir Unit 31-Bldg16
- 7390 Crackling Creek Cir
- 7414 Crackling Creek Cir
- 7438 Crackling Creek Cir
- 7462 Crackling Creek Cir
- 7441 Crackling Creek Cir
- 7417 Crackling Creek Cir Unit 24