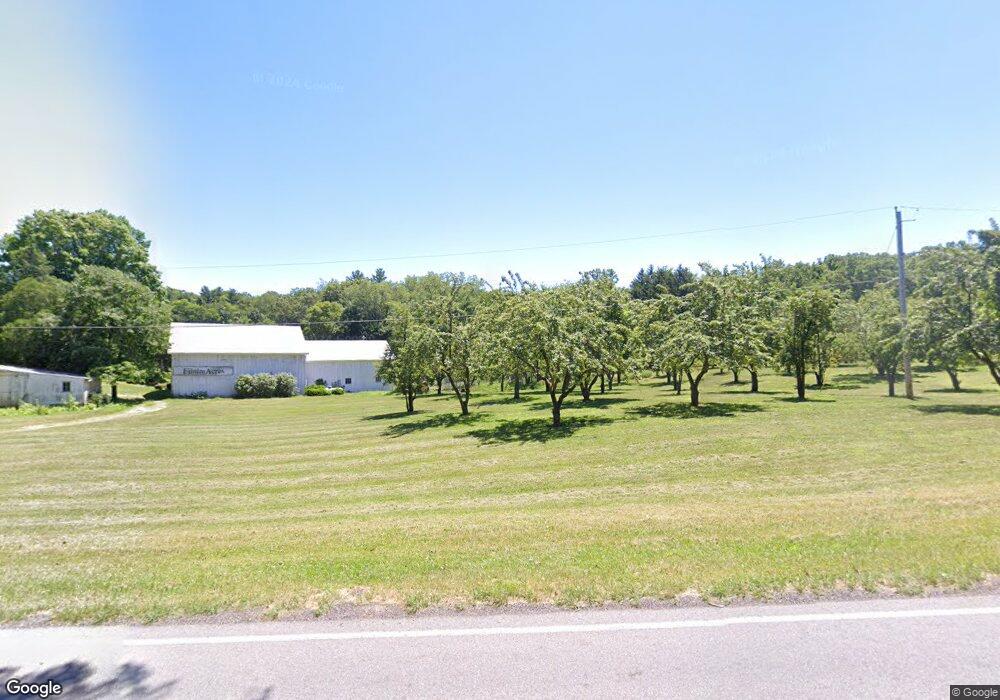
7355 N Fail Rd La Porte, IN 46350
Estimated Value: $397,000 - $415,000
3
Beds
2
Baths
1,956
Sq Ft
$208/Sq Ft
Est. Value
About This Home
This home is located at 7355 N Fail Rd, La Porte, IN 46350 and is currently estimated at $406,818, approximately $207 per square foot. 7355 N Fail Rd is a home located in LaPorte County with nearby schools including New Prairie High School.
Ownership History
Date
Name
Owned For
Owner Type
Purchase Details
Closed on
Oct 15, 2021
Sold by
John Hancock Fruit Farm Inc
Bought by
Hancock John D
Current Estimated Value
Purchase Details
Closed on
Mar 13, 2020
Sold by
John Hancock Fruit Farm Inc
Bought by
Ae Land Trust
Home Financials for this Owner
Home Financials are based on the most recent Mortgage that was taken out on this home.
Original Mortgage
$240,000
Interest Rate
3.4%
Mortgage Type
New Conventional
Create a Home Valuation Report for This Property
The Home Valuation Report is an in-depth analysis detailing your home's value as well as a comparison with similar homes in the area
Home Values in the Area
Average Home Value in this Area
Purchase History
| Date | Buyer | Sale Price | Title Company |
|---|---|---|---|
| Hancock John D | -- | None Available | |
| Ae Land Trust | -- | Liberty Title & Escrow |
Source: Public Records
Mortgage History
| Date | Status | Borrower | Loan Amount |
|---|---|---|---|
| Previous Owner | Ae Land Trust | $240,000 |
Source: Public Records
Tax History Compared to Growth
Tax History
| Year | Tax Paid | Tax Assessment Tax Assessment Total Assessment is a certain percentage of the fair market value that is determined by local assessors to be the total taxable value of land and additions on the property. | Land | Improvement |
|---|---|---|---|---|
| 2024 | $2,324 | $208,800 | $64,600 | $144,200 |
| 2022 | $2,468 | $207,600 | $63,000 | $144,600 |
| 2021 | $2,533 | $197,300 | $62,600 | $134,700 |
| 2020 | $2,875 | $197,300 | $62,600 | $134,700 |
| 2019 | $2,836 | $210,600 | $63,400 | $147,200 |
| 2018 | $2,595 | $205,900 | $63,900 | $142,000 |
| 2017 | $2,468 | $193,900 | $63,100 | $130,800 |
| 2016 | $2,776 | $200,700 | $64,400 | $136,300 |
| 2014 | $1,937 | $169,900 | $64,000 | $105,900 |
Source: Public Records
Map
Nearby Homes
- 7701 N Fail Rd
- 6707 N 200 E
- The Badin Plan at Wagner Estates
- The Kelley Plan at Wagner Estates
- The Leahy Plan at Wagner Estates
- The Gipper Plan at Wagner Estates
- The Ara Plan at Wagner Estates
- The Rockne Plan at Wagner Estates
- The Sorin Plan at Wagner Estates
- 8674 N 200 E
- 344 E 650 N
- 112 E 900 N
- 5405 N Campbell
- 9656 N 200 E
- Lots 41-44 Campbell
- 5223 N Barclay
- 135 W 900 N
- 4951 N Meadow Ct
- 0 Route 20 Unit 155390
- 10078 N Halstead Dr