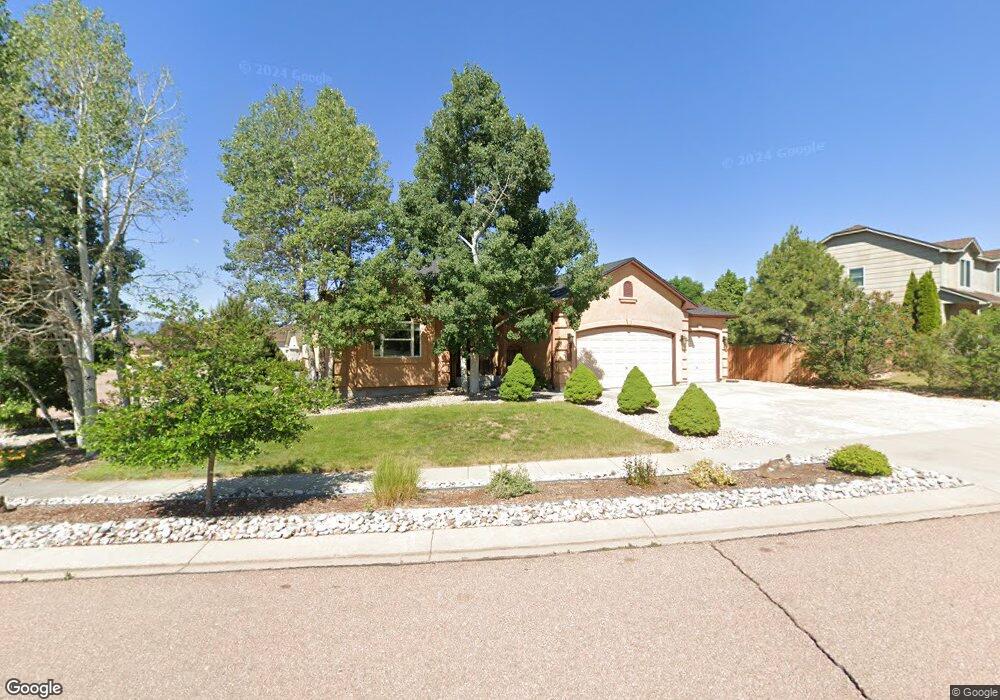
7355 Salish Blvd Colorado Springs, CO 80923
Ridgeview NeighborhoodEstimated Value: $561,412 - $587,000
4
Beds
3
Baths
1,579
Sq Ft
$360/Sq Ft
Est. Value
About This Home
This home is located at 7355 Salish Blvd, Colorado Springs, CO 80923 and is currently estimated at $568,603, approximately $360 per square foot. 7355 Salish Blvd is a home located in El Paso County with nearby schools including Stetson Elementary School, Skyview Middle School, and Sand Creek High School.
Ownership History
Date
Name
Owned For
Owner Type
Purchase Details
Closed on
Jun 29, 2018
Sold by
Tracy Della D and Tracy James L
Bought by
Gabel Eric and Gabel Lesia
Current Estimated Value
Home Financials for this Owner
Home Financials are based on the most recent Mortgage that was taken out on this home.
Original Mortgage
$380,000
Outstanding Balance
$330,055
Interest Rate
4.6%
Mortgage Type
New Conventional
Estimated Equity
$238,548
Purchase Details
Closed on
Nov 20, 2003
Sold by
Elite Properties Of America Inc
Bought by
Tracy Della D and Tracy James L
Home Financials for this Owner
Home Financials are based on the most recent Mortgage that was taken out on this home.
Original Mortgage
$183,830
Interest Rate
3.87%
Mortgage Type
Unknown
Purchase Details
Closed on
Aug 14, 2003
Sold by
Indigo Ranch Llc
Bought by
Elite Properties Of America Inc
Create a Home Valuation Report for This Property
The Home Valuation Report is an in-depth analysis detailing your home's value as well as a comparison with similar homes in the area
Home Values in the Area
Average Home Value in this Area
Purchase History
| Date | Buyer | Sale Price | Title Company |
|---|---|---|---|
| Gabel Eric | $400,000 | Empire Title Of Colorado Spr | |
| Tracy Della D | $229,788 | Land Title | |
| Elite Properties Of America Inc | $40,900 | Land Title |
Source: Public Records
Mortgage History
| Date | Status | Borrower | Loan Amount |
|---|---|---|---|
| Open | Gabel Eric | $380,000 | |
| Previous Owner | Tracy Della D | $183,830 | |
| Closed | Tracy Della D | $34,450 |
Source: Public Records
Tax History Compared to Growth
Tax History
| Year | Tax Paid | Tax Assessment Tax Assessment Total Assessment is a certain percentage of the fair market value that is determined by local assessors to be the total taxable value of land and additions on the property. | Land | Improvement |
|---|---|---|---|---|
| 2025 | $2,800 | $37,220 | -- | -- |
| 2024 | $2,987 | $37,260 | $6,470 | $30,790 |
| 2023 | $2,987 | $37,260 | $6,470 | $30,790 |
| 2022 | $2,508 | $27,580 | $5,840 | $21,740 |
| 2021 | $2,631 | $28,380 | $6,010 | $22,370 |
| 2020 | $2,165 | $24,900 | $5,010 | $19,890 |
| 2019 | $2,148 | $24,900 | $5,010 | $19,890 |
| 2018 | $1,971 | $22,570 | $4,380 | $18,190 |
| 2017 | $1,978 | $22,570 | $4,380 | $18,190 |
| 2016 | $1,949 | $22,670 | $4,120 | $18,550 |
| 2015 | $1,951 | $22,670 | $4,120 | $18,550 |
| 2014 | $1,737 | $19,900 | $3,900 | $16,000 |
Source: Public Records
Map
Nearby Homes
- 5739 Brennan Ave
- 7368 Prythania Park Dr
- 7340 Amberly Dr
- 5889 Brennan Ave
- 5625 Dusty Chaps Dr
- 5919 Brennan Ave
- 5918 Whiskey River Dr
- 7668 Amberly Dr
- 7533 Amberly Dr
- 6016 Wild Bill Way
- 7525 Stetson Highlands Dr
- 7583 Manistique Dr
- 6292 Tenderfoot Dr
- 5412 Statute Dr
- 5225 Stone Fence Dr
- 5718 Badenoch Terrace
- 7674 Stetson Highlands Dr
- 5466 Arden Grove
- 6771 Sunny Alp St
- 6481 Summer Grace St
- 7335 Salish Blvd
- 7276 Amberly Dr
- 7285 Amberly Dr
- 7277 Amberly Dr
- 5763 Brennan Ave
- 5757 Brennan Ave
- 7268 Amberly Dr
- 5769 Brennan Ave
- 7293 Amberly Dr
- 5751 Brennan Ave
- 7302 Flathead Lake Dr
- 7301 Amberly Dr
- 5745 Brennan Ave
- 7260 Amberly Dr
- 7318 Corsicana Dr
- 7308 Amberly Dr
- 7319 Flathead Lake Dr
- 7308 Flathead Lake Dr
- 7253 Amberly Dr
- 7309 Amberly Dr