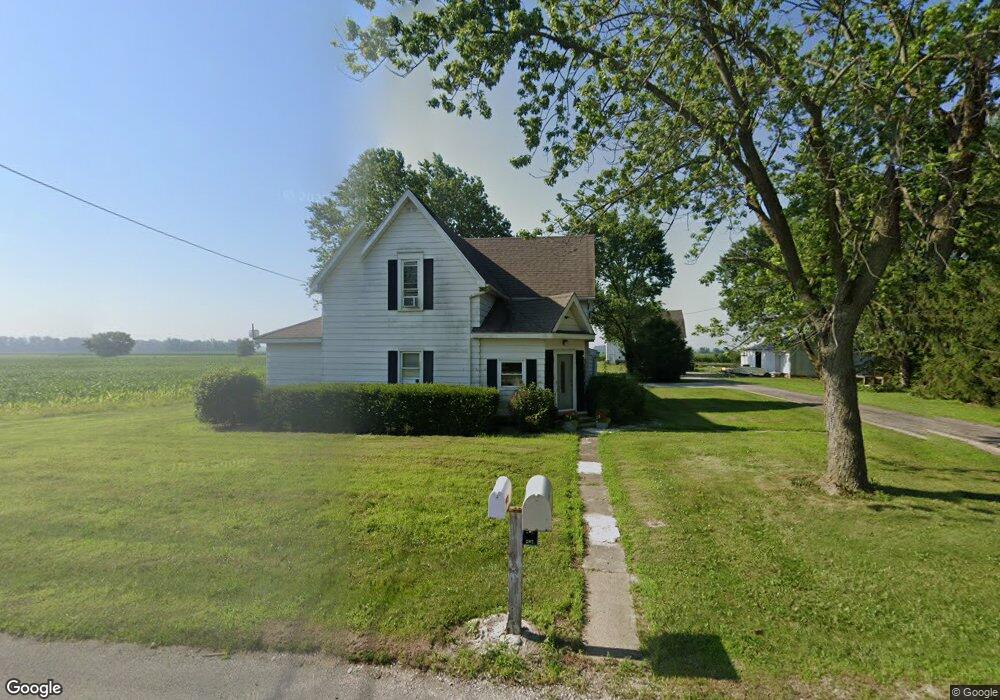
7357 W 500 S Swayzee, IN 46986
Estimated Value: $175,294 - $266,000
4
Beds
2
Baths
2,160
Sq Ft
$103/Sq Ft
Est. Value
About This Home
This home is located at 7357 W 500 S, Swayzee, IN 46986 and is currently estimated at $221,824, approximately $102 per square foot. 7357 W 500 S is a home located in Grant County with nearby schools including Madison-Grant Junior/Senior High School.
Ownership History
Date
Name
Owned For
Owner Type
Purchase Details
Closed on
Jan 17, 2014
Sold by
Key Melvin E and Key Waneta K
Bought by
Rosman Craig A
Current Estimated Value
Home Financials for this Owner
Home Financials are based on the most recent Mortgage that was taken out on this home.
Original Mortgage
$82,500
Outstanding Balance
$23,308
Interest Rate
4.42%
Mortgage Type
New Conventional
Estimated Equity
$198,516
Purchase Details
Closed on
Dec 24, 2010
Sold by
Key Melvin E
Bought by
Rossman Macie and Rossman Craig
Create a Home Valuation Report for This Property
The Home Valuation Report is an in-depth analysis detailing your home's value as well as a comparison with similar homes in the area
Home Values in the Area
Average Home Value in this Area
Purchase History
| Date | Buyer | Sale Price | Title Company |
|---|---|---|---|
| Rosman Craig A | -- | None Available | |
| Rossman Macie | $100,000 | -- |
Source: Public Records
Mortgage History
| Date | Status | Borrower | Loan Amount |
|---|---|---|---|
| Open | Rosman Craig A | $82,500 |
Source: Public Records
Tax History Compared to Growth
Tax History
| Year | Tax Paid | Tax Assessment Tax Assessment Total Assessment is a certain percentage of the fair market value that is determined by local assessors to be the total taxable value of land and additions on the property. | Land | Improvement |
|---|---|---|---|---|
| 2024 | $597 | $114,300 | $19,900 | $94,400 |
| 2023 | $610 | $115,300 | $19,900 | $95,400 |
| 2022 | $616 | $110,900 | $19,900 | $91,000 |
| 2021 | $704 | $100,800 | $19,900 | $80,900 |
| 2020 | $642 | $100,100 | $19,900 | $80,200 |
| 2019 | $647 | $100,100 | $19,900 | $80,200 |
| 2018 | $649 | $100,100 | $19,900 | $80,200 |
| 2017 | $606 | $99,400 | $19,900 | $79,500 |
| 2016 | $393 | $99,400 | $19,900 | $79,500 |
| 2014 | $392 | $99,600 | $20,300 | $79,300 |
| 2013 | $392 | $98,900 | $20,300 | $78,600 |
Source: Public Records
Map
Nearby Homes
- 6659 W 400 S
- 606 S Sims St
- 207 W Lincoln St
- 207 W Marks St
- 109 S Main St
- 105 N Main St
- 8011 S 800 W
- 9502 W 800 S
- 8060 W 900 S
- 1252 S 600 W
- 600 E 900 S
- 9420 W North 00 S 27
- 71 S 1100 E
- 13972 County Road East 500 S
- 10035 S Strawtown Pike
- 203 Eagle Dr
- 110 Greenberry St
- 0 Pennsylvania Ave
- 7405 W Mier 27
- 218 Greenberry St