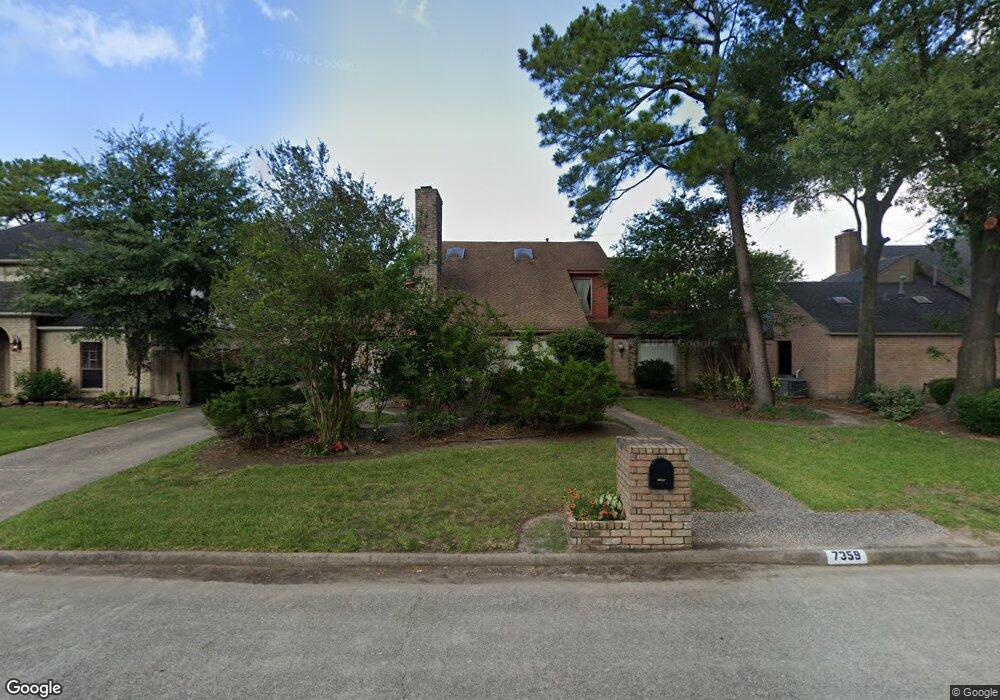
7359 Athlone Dr Houston, TX 77088
Greater Inwood NeighborhoodEstimated Value: $412,000 - $436,000
4
Beds
4
Baths
3,247
Sq Ft
$132/Sq Ft
Est. Value
About This Home
This home is located at 7359 Athlone Dr, Houston, TX 77088 and is currently estimated at $426,996, approximately $131 per square foot. 7359 Athlone Dr is a home located in Harris County with nearby schools including Edward a Vines EC/Pre-K/K School, Harris Elementary School, and Hoffman Middle School.
Ownership History
Date
Name
Owned For
Owner Type
Purchase Details
Closed on
Dec 20, 2024
Sold by
Hazel V Jones Revocable Living Trust and Jones Hazel V
Bought by
Dorsey Catherine Deborah
Current Estimated Value
Purchase Details
Closed on
Oct 20, 2012
Sold by
Jones Hazel V
Bought by
The Hazel V Jones Revocable Living Trust
Purchase Details
Closed on
Aug 7, 2012
Sold by
Jones Hazel V
Bought by
Hazel V Jones Revocable Living Trust
Purchase Details
Closed on
Aug 14, 1998
Sold by
Jones Hazel Vickers
Bought by
Jones Hazel and The Hazel V Jones Revocable Living Trust
Purchase Details
Closed on
Apr 22, 1998
Sold by
Argo J R and Argo Maria
Bought by
Jones Hazel
Home Financials for this Owner
Home Financials are based on the most recent Mortgage that was taken out on this home.
Original Mortgage
$116,000
Interest Rate
7.09%
Create a Home Valuation Report for This Property
The Home Valuation Report is an in-depth analysis detailing your home's value as well as a comparison with similar homes in the area
Home Values in the Area
Average Home Value in this Area
Purchase History
| Date | Buyer | Sale Price | Title Company |
|---|---|---|---|
| Dorsey Catherine Deborah | -- | None Listed On Document | |
| Dorsey Catherine Deborah | -- | None Listed On Document | |
| The Hazel V Jones Revocable Living Trust | -- | None Available | |
| Hazel V Jones Revocable Living Trust | -- | None Available | |
| Jones Hazel | -- | None Available | |
| Jones Hazel | -- | Fidelity National Title |
Source: Public Records
Mortgage History
| Date | Status | Borrower | Loan Amount |
|---|---|---|---|
| Previous Owner | Jones Hazel | $116,000 |
Source: Public Records
Tax History Compared to Growth
Tax History
| Year | Tax Paid | Tax Assessment Tax Assessment Total Assessment is a certain percentage of the fair market value that is determined by local assessors to be the total taxable value of land and additions on the property. | Land | Improvement |
|---|---|---|---|---|
| 2025 | $149 | $384,969 | $80,625 | $304,344 |
| 2024 | $149 | $320,000 | $80,625 | $239,375 |
| 2023 | $149 | $315,127 | $80,625 | $234,502 |
| 2022 | $6,703 | $304,962 | $80,625 | $224,337 |
| 2021 | $6,381 | $254,030 | $50,391 | $203,639 |
| 2020 | $7,345 | $278,263 | $43,538 | $234,725 |
| 2019 | $7,512 | $271,453 | $43,538 | $227,915 |
| 2018 | $1,129 | $306,000 | $43,538 | $262,462 |
| 2017 | $6,329 | $316,357 | $43,538 | $272,819 |
| 2016 | $5,754 | $255,814 | $43,538 | $212,276 |
| 2015 | $1,258 | $248,179 | $43,538 | $204,641 |
| 2014 | $1,258 | $219,531 | $43,538 | $175,993 |
Source: Public Records
Map
Nearby Homes
- 7331 Athlone Dr
- 3919 Badger Forest Dr
- 4015 Black Locust Dr
- 3711 Black Locust Dr
- 4206 Saratoga Dr
- 4306 Saratoga Dr
- 7200 T C Jester Blvd Unit 24
- 7611 Athlone Dr
- 3503 Cherry Forest Dr
- 7816 Inwood Grove Ln
- DOVE Plan at Alaia Crossing
- CEDAR Plan at Alaia Crossing
- BOXWOOD Plan at Alaia Crossing
- 4444 Victory Dr Unit 1311
- 4444 Victory Dr Unit 1108
- 7705 Inwood Grove Ln
- 7707 Inwood Grove Ln
- 7712 Inwood Grove Ln
- 7610 Alperton Dr
- 7709 Inwood Hills Ln
- 7355 Athlone Dr
- 7363 Athlone Dr
- 7351 Athlone Dr
- 3923 Elmcrest Dr
- 3926 Elmcrest Dr
- 3918 Cherry Forest Dr
- 7347 Athlone Dr
- 3922 Elmcrest Dr
- 3919 Elmcrest Dr
- 7343 Athlone Dr
- 3918 Elmcrest Dr
- 3910 Cherry Forest Dr
- 3915 Elmcrest Dr
- 3919 Cherry Forest Dr
- 3915 Cherry Forest Dr
- 7339 Athlone Dr
- 3914 Elmcrest Dr
- 3906 Cherry Forest Dr
- 3911 Cherry Forest Dr
- 3950 Victory Dr