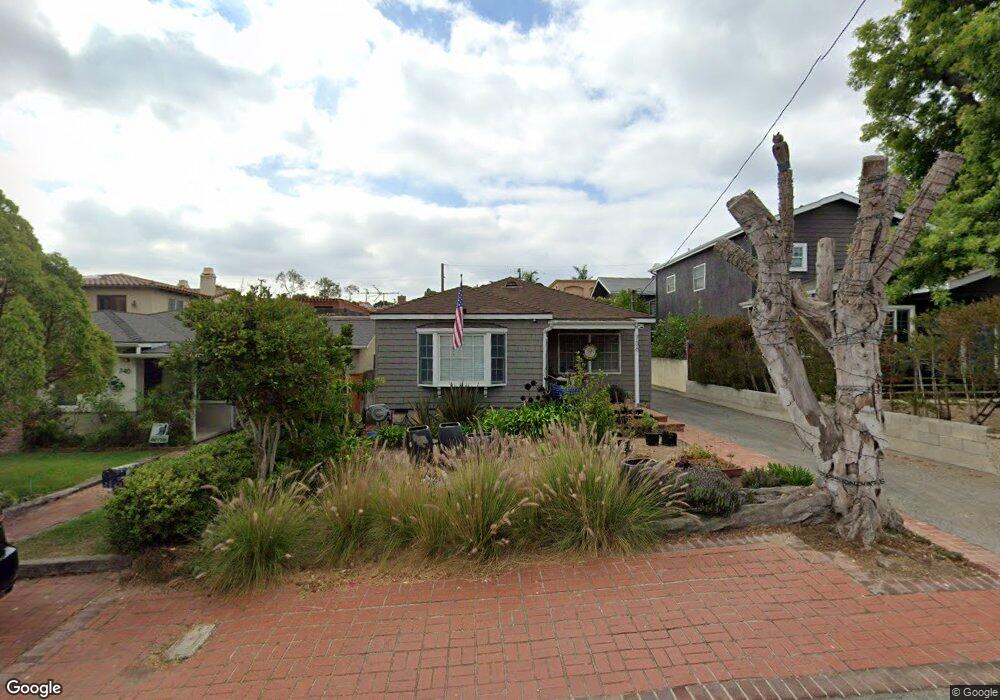
736 36th St Manhattan Beach, CA 90266
Estimated Value: $2,032,524 - $2,847,000
2
Beds
1
Bath
985
Sq Ft
$2,559/Sq Ft
Est. Value
About This Home
This home is located at 736 36th St, Manhattan Beach, CA 90266 and is currently estimated at $2,520,381, approximately $2,558 per square foot. 736 36th St is a home located in Los Angeles County with nearby schools including Grand View Elementary School, Manhattan Beach Middle School, and Mira Costa High School.
Ownership History
Date
Name
Owned For
Owner Type
Purchase Details
Closed on
Mar 15, 2001
Sold by
Bryan Gregory T and The Gregory T Bryan Living Tru
Bought by
Minn Robert J and Minn Elyssa Trang Vuong
Current Estimated Value
Home Financials for this Owner
Home Financials are based on the most recent Mortgage that was taken out on this home.
Original Mortgage
$488,000
Outstanding Balance
$179,954
Interest Rate
7.19%
Estimated Equity
$2,340,427
Purchase Details
Closed on
Jun 29, 1998
Sold by
Bryan Greg
Bought by
Bryan Gregory T and Gregory T Bryan Living Trust
Create a Home Valuation Report for This Property
The Home Valuation Report is an in-depth analysis detailing your home's value as well as a comparison with similar homes in the area
Home Values in the Area
Average Home Value in this Area
Purchase History
| Date | Buyer | Sale Price | Title Company |
|---|---|---|---|
| Minn Robert J | $610,000 | Southland Title Corporation | |
| Bryan Gregory T | -- | -- |
Source: Public Records
Mortgage History
| Date | Status | Borrower | Loan Amount |
|---|---|---|---|
| Open | Minn Robert J | $488,000 | |
| Closed | Minn Robert J | $61,000 |
Source: Public Records
Tax History
| Year | Tax Paid | Tax Assessment Tax Assessment Total Assessment is a certain percentage of the fair market value that is determined by local assessors to be the total taxable value of land and additions on the property. | Land | Improvement |
|---|---|---|---|---|
| 2025 | $10,586 | $919,154 | $735,332 | $183,822 |
| 2024 | $10,586 | $901,132 | $720,914 | $180,218 |
| 2023 | $10,262 | $883,464 | $706,779 | $176,685 |
| 2022 | $10,089 | $866,142 | $692,921 | $173,221 |
| 2021 | $9,956 | $849,160 | $679,335 | $169,825 |
| 2019 | $9,694 | $823,976 | $659,187 | $164,789 |
| 2018 | $9,471 | $807,820 | $646,262 | $161,558 |
| 2016 | $8,689 | $776,454 | $621,168 | $155,286 |
| 2015 | $8,509 | $764,792 | $611,838 | $152,954 |
| 2014 | $8,396 | $749,811 | $599,853 | $149,958 |
Source: Public Records
Map
Nearby Homes
Your Personal Tour Guide
Ask me questions while you tour the home.