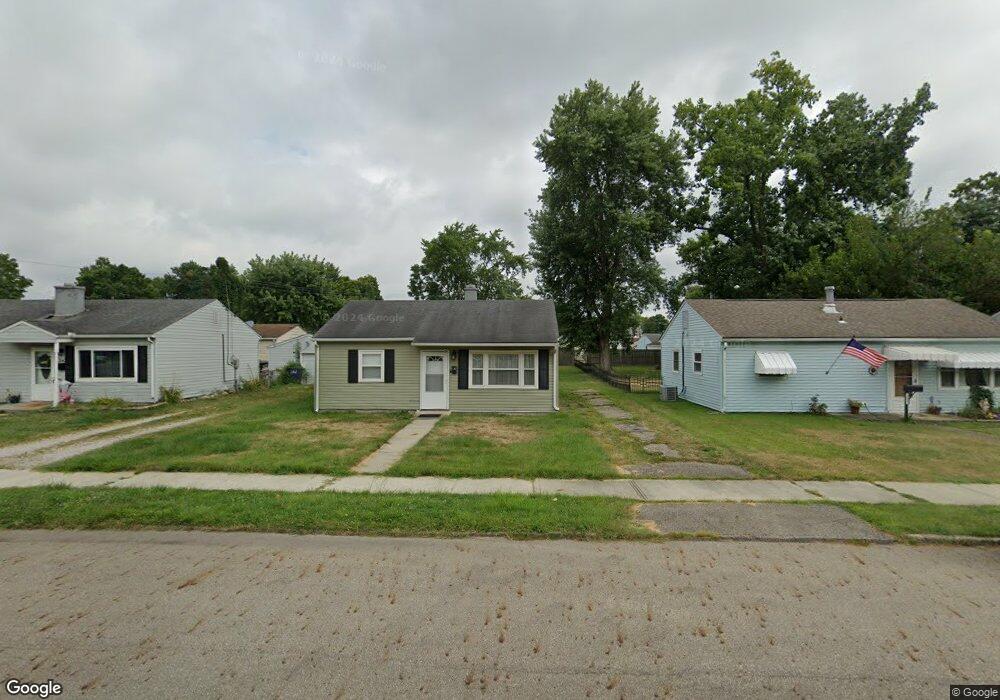
736 Cherokee Dr Lancaster, OH 43130
Estimated Value: $137,780 - $156,000
2
Beds
1
Bath
672
Sq Ft
$219/Sq Ft
Est. Value
About This Home
This home is located at 736 Cherokee Dr, Lancaster, OH 43130 and is currently estimated at $147,195, approximately $219 per square foot. 736 Cherokee Dr is a home located in Fairfield County with nearby schools including Thomas Ewing Junior High School, Lancaster High School, and St Mary Elementary School.
Ownership History
Date
Name
Owned For
Owner Type
Purchase Details
Closed on
May 5, 2025
Sold by
Wolfe Timothy P and Wolfe Lisa M
Bought by
Wolfe Family Trust and Wolfe
Current Estimated Value
Purchase Details
Closed on
Feb 5, 2013
Sold by
Wolfe Timothy P and Wolfe Timothy P
Bought by
Wolfe Timothy P and Wolfe Lisa M
Purchase Details
Closed on
Mar 13, 2001
Sold by
Roley Shannon J
Bought by
Wolfe Timothy P
Home Financials for this Owner
Home Financials are based on the most recent Mortgage that was taken out on this home.
Original Mortgage
$47,200
Interest Rate
7.18%
Mortgage Type
New Conventional
Purchase Details
Closed on
Feb 17, 1999
Sold by
Fernon Thomas B
Bought by
Roley Shannon J
Home Financials for this Owner
Home Financials are based on the most recent Mortgage that was taken out on this home.
Original Mortgage
$48,000
Interest Rate
8%
Mortgage Type
New Conventional
Create a Home Valuation Report for This Property
The Home Valuation Report is an in-depth analysis detailing your home's value as well as a comparison with similar homes in the area
Home Values in the Area
Average Home Value in this Area
Purchase History
| Date | Buyer | Sale Price | Title Company |
|---|---|---|---|
| Wolfe Family Trust | -- | None Listed On Document | |
| Wolfe Timothy P | -- | None Available | |
| Wolfe Timothy P | $52,500 | -- | |
| Roley Shannon J | $43,500 | -- |
Source: Public Records
Mortgage History
| Date | Status | Borrower | Loan Amount |
|---|---|---|---|
| Previous Owner | Wolfe Timothy P | $47,200 | |
| Previous Owner | Roley Shannon J | $48,000 |
Source: Public Records
Tax History
| Year | Tax Paid | Tax Assessment Tax Assessment Total Assessment is a certain percentage of the fair market value that is determined by local assessors to be the total taxable value of land and additions on the property. | Land | Improvement |
|---|---|---|---|---|
| 2025 | $2,776 | $43,740 | $15,690 | $28,050 |
| 2024 | $2,776 | $30,880 | $5,770 | $25,110 |
| 2023 | $1,148 | $30,880 | $5,770 | $25,110 |
| 2022 | $1,154 | $30,880 | $5,770 | $25,110 |
| 2021 | $876 | $21,970 | $5,770 | $16,200 |
| 2020 | $280 | $21,970 | $5,770 | $16,200 |
| 2019 | $800 | $21,970 | $5,770 | $16,200 |
| 2018 | $202 | $17,350 | $5,770 | $11,580 |
| 2017 | $675 | $17,580 | $5,770 | $11,810 |
| 2016 | $657 | $17,580 | $5,770 | $11,810 |
| 2015 | $657 | $17,040 | $5,770 | $11,270 |
| 2014 | $626 | $17,040 | $5,770 | $11,270 |
| 2013 | $626 | $17,040 | $5,770 | $11,270 |
Source: Public Records
Map
Nearby Homes
- 834 E Main St
- 844 E Wheeling St
- 1106 E Walnut St
- 1113 E Locust St
- 869 E Mulberry St
- 859 E Mulberry St
- 515 E Chestnut St
- 534 E Wheeling St
- 621 E Mulberry St
- 403 S Ewing St
- 641 King St
- 547 E Mulberry St
- 429 E Locust St
- 414 E Walnut St
- 610 E 5th Ave
- 342 E Chestnut St
- 1403 E Chestnut St
- 612 Oakwood Ave
- 138 N Ewing St
- 621 Harding Ave
- 732 Cherokee Dr
- 742 Cherokee Dr
- 726 Cherokee Dr
- 766 Cherokee Dr
- 754 Cherokee Dr
- 794 Cherokee Dr
- 722 Cherokee Dr
- 788 Cherokee Dr
- 798 Cherokee Dr
- 774 Cherokee Dr
- 800 Cherokee Dr
- 741 Cherokee Dr
- 716 Cherokee Dr
- 804 Cherokee Dr
- 737 Cherokee Dr
- 731 Cherokee Dr
- 753 Cherokee Dr
- 810 Cherokee Dr
- 727 Cherokee Dr
- 712 Cherokee Dr
Your Personal Tour Guide
Ask me questions while you tour the home.